QUESTION IMAGE
Question
algebra i b-cr
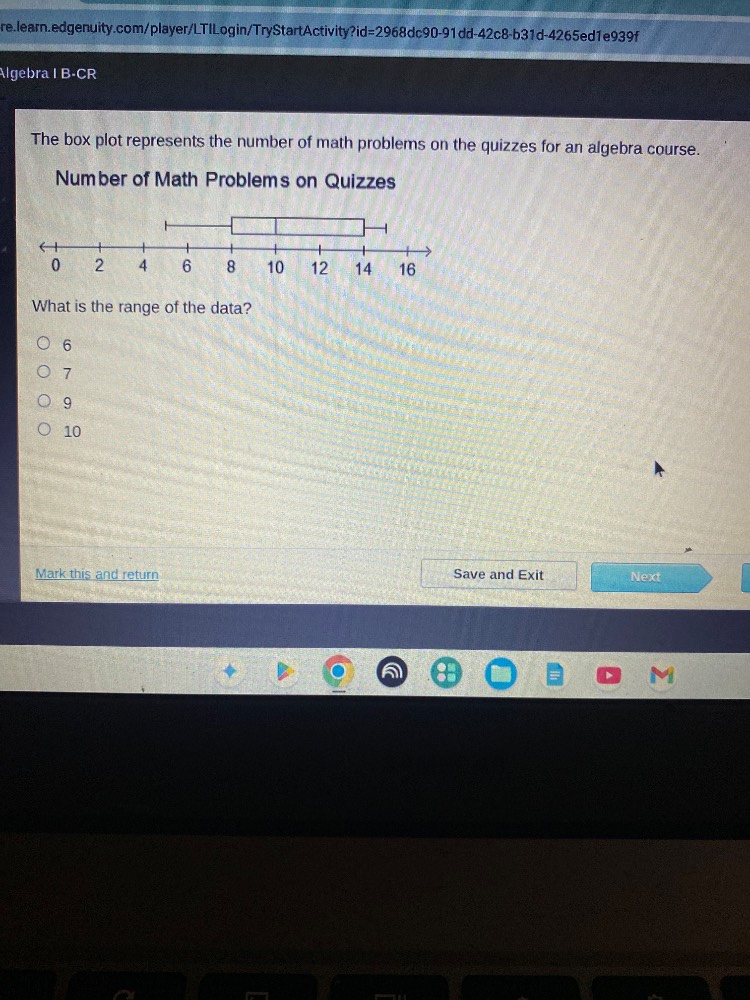
the box plot represents the number of math problems on the quizzes for an algebra course.
number of math problems on quizzes
0 2 4 6 8 10 12 14 16
what is the range of the data?
○ 6
○ 7
○ 9
○ 10
Step1: Identify max and min values
From the box plot, the maximum value is 15, the minimum value is 6.
Step2: Calculate the range
Range = Max value - Min value
$\text{Range} = 15 - 6$

Snap & solve any problem in the app
Get step-by-step solutions on Sovi AI
Photo-based solutions with guided steps
Explore more problems and detailed explanations
10