QUESTION IMAGE
Question
algebra i b-cr
time remaining
56:01
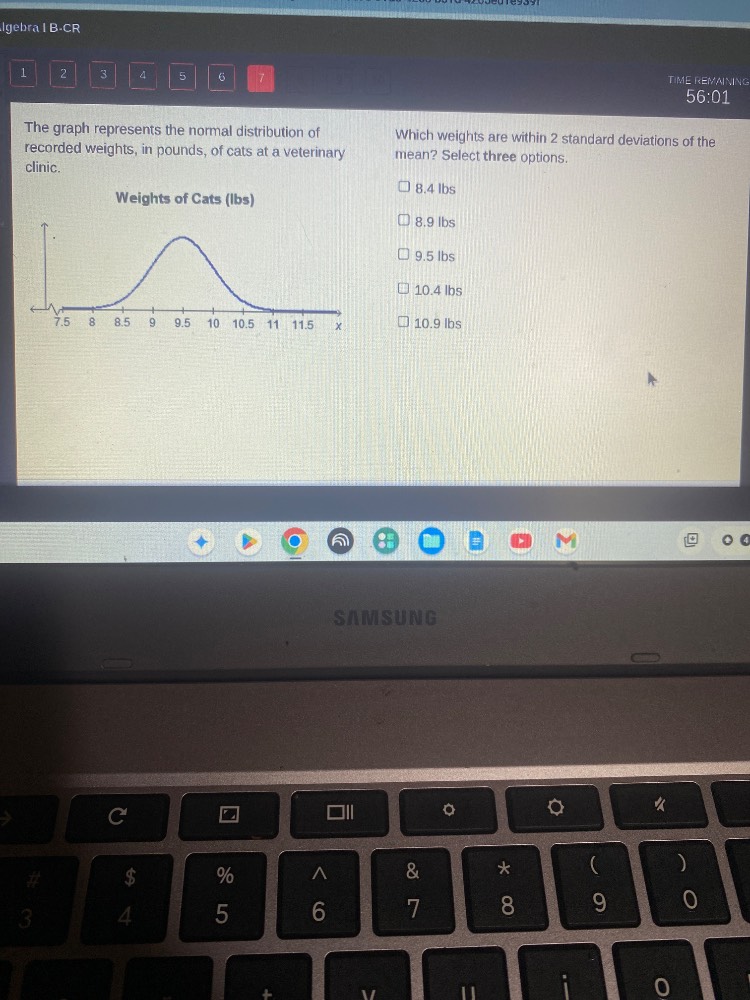
the graph represents the normal distribution of recorded weights, in pounds, of cats at a veterinary clinic.
weights of cats (lbs)
which weights are within 2 standard deviations of the mean? select three options.
□ 8.4 lbs
□ 8.9 lbs
□ 9.5 lbs
□ 10.4 lbs
□ 10.9 lbs
Step1: Identify mean from graph
The peak of the normal distribution is at $\mu = 9.5$ lbs.
Step2: Find standard deviation
The distance from mean to first inflection point (or the interval for 1 SD) is $\sigma = 1$ lb (since the graph spans 7.5 to 11.5, total 4 SD: $\frac{11.5-7.5}{4}=1$).
Step3: Calculate 2 SD range
Lower bound: $\mu - 2\sigma = 9.5 - 2(1) = 7.5$ lbs
Upper bound: $\mu + 2\sigma = 9.5 + 2(1) = 11.5$ lbs
Step4: Filter valid weights
Check which values are between 7.5 and 11.5, and select three:
- 8.9 lbs: $7.5 < 8.9 < 11.5$
- 9.5 lbs: $7.5 < 9.5 < 11.5$
- 10.4 lbs: $7.5 < 10.4 < 11.5$

Snap & solve any problem in the app
Get step-by-step solutions on Sovi AI
Photo-based solutions with guided steps
Explore more problems and detailed explanations
B. 8.9 lbs, C. 9.5 lbs, D. 10.4 lbs