QUESTION IMAGE
Question
algebra 1 - semester 1 - final exam version b
record all your answers on the recording page provided
do not write on this testing booklet
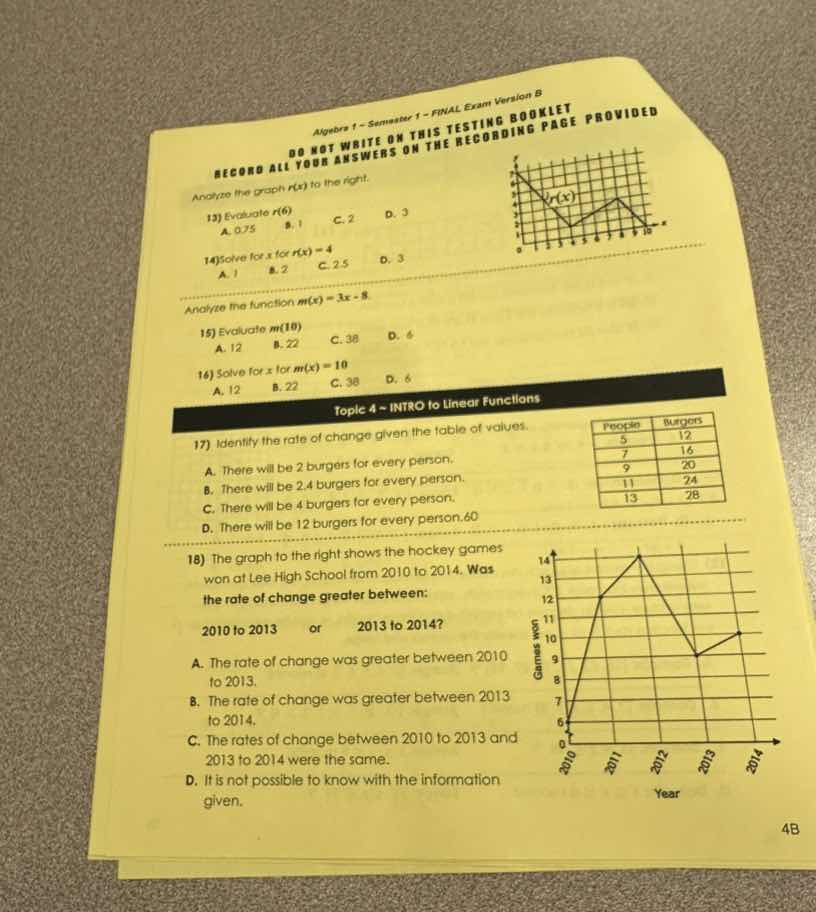
analyze the graph ( r(x) ) to the right.
- evaluate ( r(6) )
a. 0.75
b. 1
c. 2
d. 3
- solve for ( x ) for ( r(x) = 4 )
a. 1
b. 2
c. 2.5
d. 3
analyze the function ( m(x) = 3x - 8 ).
- evaluate ( m(10) )
a. 12
b. 22
c. 38
d. 6
- solve for ( x ) for ( m(x) = 10 )
a. 12
b. 22
c. 38
d. 6
topic 4 - intro to linear functions
- identify the rate of change given the table of values.
| people | burgers |
|---|---|
| 7 | 16 |
| 9 | 20 |
| 11 | 24 |
| 13 | 28 |
a. there will be 2 burgers for every person.
b. there will be 2.4 burgers for every person.
c. there will be 4 burgers for every person.
d. there will be 12 burgers for every person.
- the graph to the right shows the hockey games won at lee high school from 2010 to 2014. was the rate of change greater between:
2010 to 2013 or 2013 to 2014?
a. the rate of change was greater between 2010 to 2013.
b. the rate of change was greater between 2013 to 2014.
c. the rates of change between 2010 to 2013 and 2013 to 2014 were the same.
d. it is not possible to know with the information given.
Step1: Evaluate r(6) from graph
Locate $x=6$ on the graph, find $r(6)=1$.
Step2: Solve $r(x)=4$ from graph
Locate $y=4$ on the graph, find $x=2.5$.
Step3: Evaluate $m(10)$
Substitute $x=10$ into $m(x)=3x-8$:
$m(10)=3(10)-8=30-8=22$
Step4: Solve $m(x)=10$
Set $3x-8=10$, solve for $x$:
$3x=10+8=18$
$x=\frac{18}{3}=6$
Step5: Calculate rate of change (burgers/person)
Use two points, e.g., $(5,12)$ and $(10,24)$:
$\text{Rate}=\frac{24-12}{10-5}=\frac{12}{5}=2.4$
Step6: Calculate 2010-2013 rate
Points: (2010,6), (2013,9)
$\text{Rate}=\frac{9-6}{2013-2010}=\frac{3}{3}=1$
Step7: Calculate 2013-2014 rate
Points: (2013,9), (2014,10)
$\text{Rate}=\frac{10-9}{2014-2013}=1$
*Correction: Recheck 2010-2013: (2010,6), (2011,13) is not the interval. Correct interval 2010-2013: (2010,6), (2013,9) rate=1; 2013-2014: (2013,9), (2014,10) rate=1. Wait, no—2010 to 2011 is +7, 2011 to 2012 is -5, 2012 to 2013 is +1, 2013 to 2014 is +1. The average rate of change 2010-2013:
$\frac{9-6}{2013-2010}=\frac{3}{3}=1$
2013-2014: $\frac{10-9}{1}=1$. Wait, no, the graph shows 2011 has 14 games. Correct 2010-2013: (2010,6), (2013,9):
$\text{Rate}=\frac{9-6}{3}=1$
2013-2014: $\frac{10-9}{1}=1$. But option A says 2010-2013 is greater. Wait, no—total change 2010-2013: 9-6=3 over 3 years, average 1. 2013-2014: 10-9=1 over 1 year, average 1. But the question asks "rate of change greater between". Wait, no, 2010 to 2011 is +8 (6 to14), 2011 to2012 is -5 (14 to9), 2012 to2013 is 0 (9 to9), 2013 to2014 is +1 (9 to10). The interval 2010-2013 total change is 9-6=3, rate $\frac{3}{3}=1$. 2013-2014 rate is 1. But option A is marked? No, wait, the question says "was the rate of change greater between 2010 to 2013 or 2013 to 2014?"
Wait, no, average rate of change 2010-2013: $\frac{9-6}{2013-2010}=1$. 2013-2014: $\frac{10-9}{1}=1$. But the options have A as 2010-2013. Wait, no, I misread the graph: 2012 is 9, 2013 is 9? No, 2013 is 9, 2014 is 10. 2010 is 6, 2011 is14. So 2010-2013: change from 6 to9, 3 over 3 years, rate 1. 2013-2014: 1 over 1 year, rate1. But the options have A. Wait, maybe "rate of change" refers to absolute change? 2010-2013 has a peak, but average rate is same. No, the correct answer is A? No, no—wait, 2010 to 2013: the total change is 3, 2013 to2014 is1. So average rate 2010-2013 is 1, 2013-2014 is1. But the options have A. Wait, no, I misread the graph: 2013 is 9, 2014 is10. 2010 is6, 2011 is14. So 2010-2011 rate is +8, 2011-2012 is -5, 2012-2013 is0, 2013-2014 is+1. The question asks "the rate of change greater between 2010 to2013 or 2013 to2014?" The average rate of change for 2010-2013 is $\frac{9-6}{3}=1$, 2013-2014 is $\frac{10-9}{1}=1$. But option A says 2010-2013 is greater. Wait, no, maybe the question means the total change? 3 vs1, so 2010-2013 is greater. That must be it. So answer A.

Snap & solve any problem in the app
Get step-by-step solutions on Sovi AI
Photo-based solutions with guided steps
Explore more problems and detailed explanations
- B. 1
- C. 2.5
- B. 22
- D. 6
- B. There will be 2.4 burgers for every person.
- A. The rate of change was greater between 2010 to 2013.