QUESTION IMAGE
Question
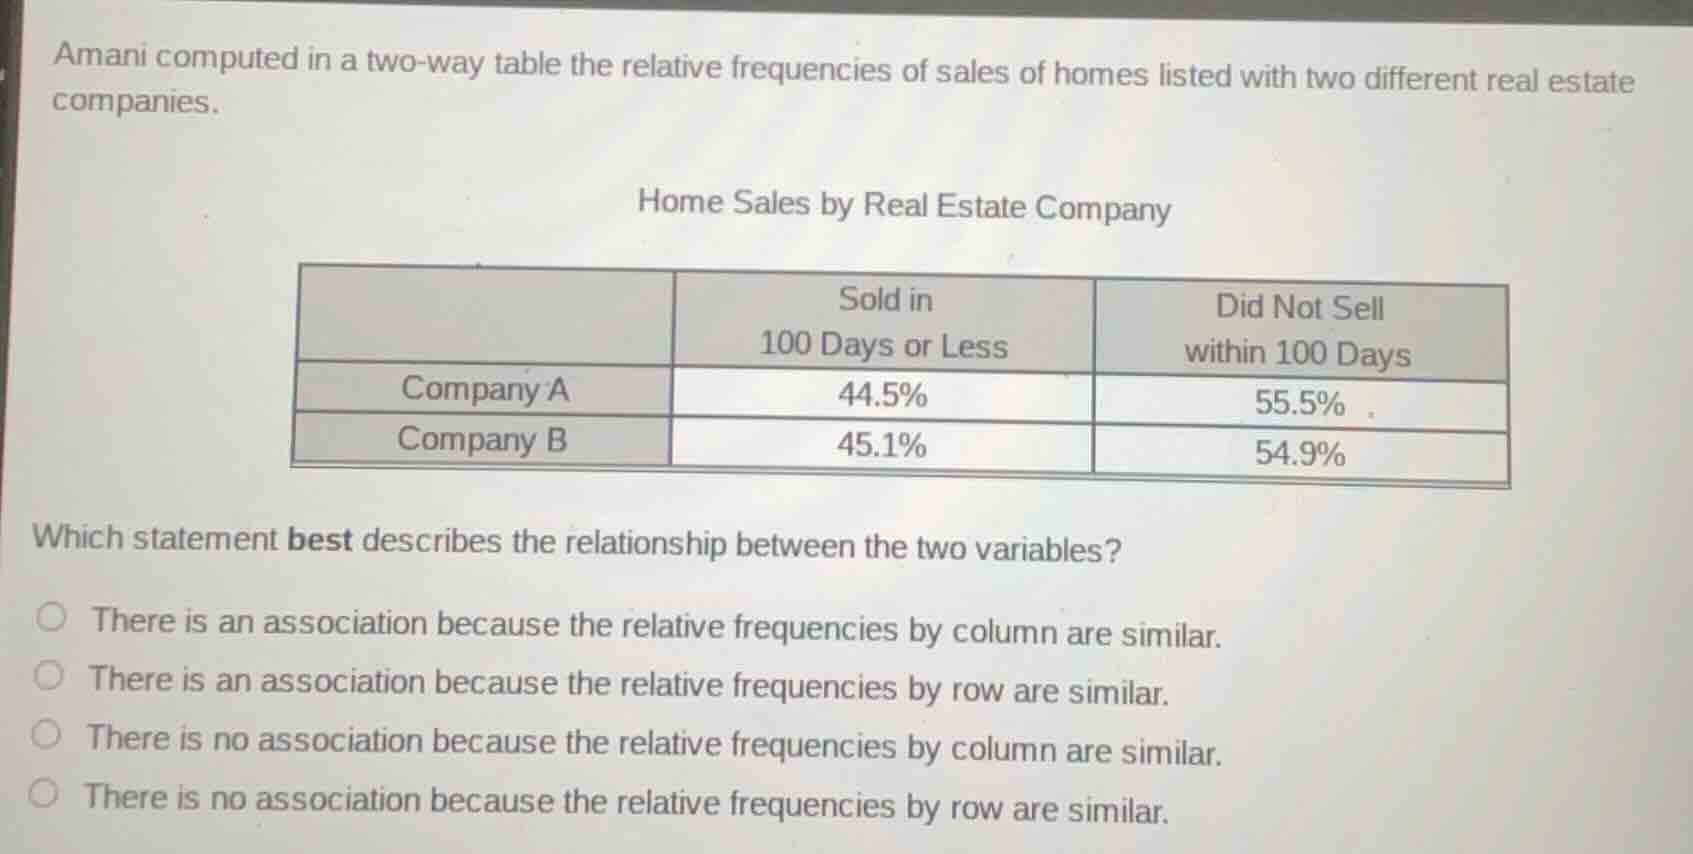
amani computed in a two - way table the relative frequencies of sales of homes listed with two different real estate companies.
home sales by real estate company
| sold in 100 days or less | did not sell within 100 days | |
|---|---|---|
| company b | 45.1% | 54.9% |
which statement best describes the relationship between the two variables?
- there is an association because the relative frequencies by column are similar.
- there is an association because the relative frequencies by row are similar.
- there is no association because the relative frequencies by column are similar.
- there is no association because the relative frequencies by row are similar.
First, analyze the relative frequencies: For Company A, 44.5% sold in ≤100 days and 55.5% did not; for Company B, 45.1% sold in ≤100 days and 54.9% did not. The row relative frequencies (percentages for each company's sales outcomes) are very similar. When row/column relative frequencies across groups are similar, it means there is no association between the variables (real estate company and home sale timeline), as the outcome distribution is nearly identical for both companies.

Snap & solve any problem in the app
Get step-by-step solutions on Sovi AI
Photo-based solutions with guided steps
Explore more problems and detailed explanations
There is no association because the relative frequencies by row are similar.