QUESTION IMAGE
Question
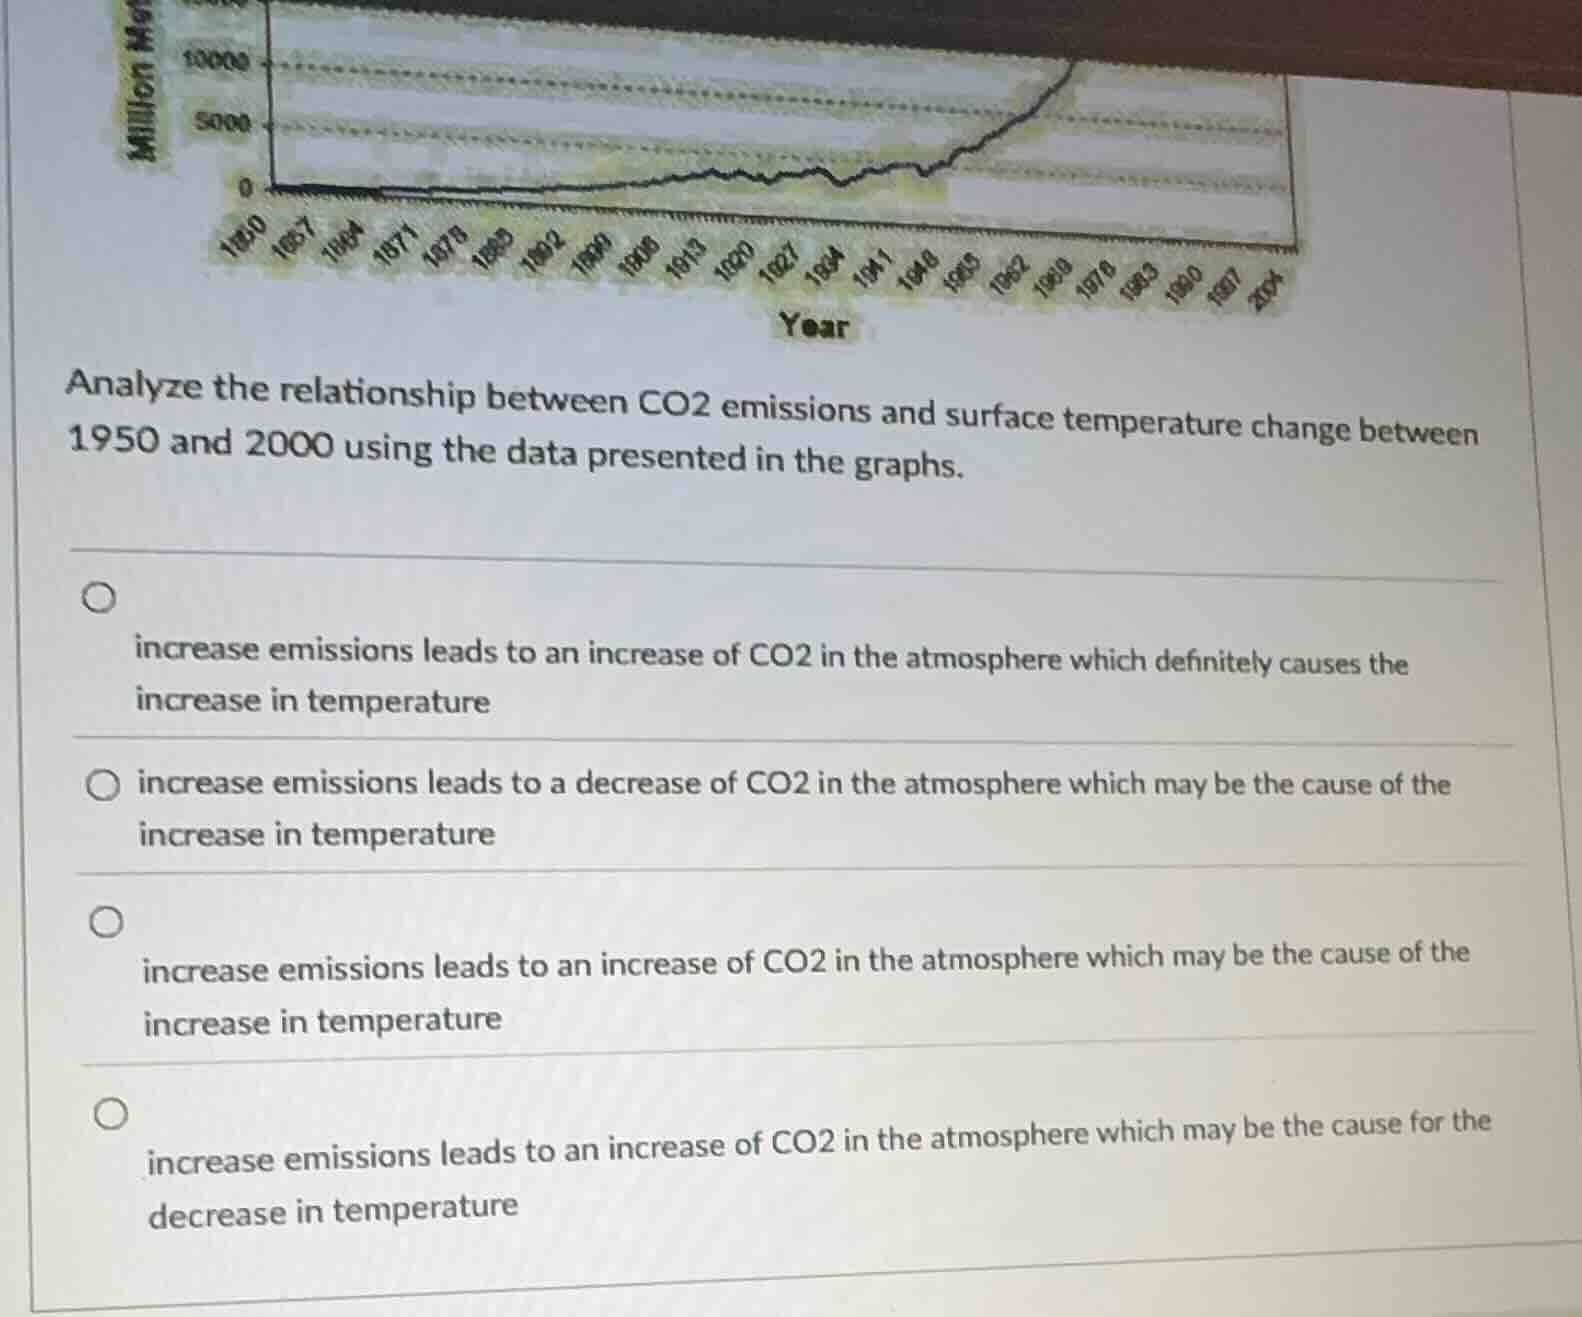
analyze the relationship between co2 emissions and surface temperature change between 1950 and 2000 using the data presented in the graphs. \
\
\bigcirc increase emissions leads to an increase of co2 in the atmosphere which definitely causes the increase in temperature \
\bigcirc increase emissions leads to a decrease of co2 in the atmosphere which may be the cause of the increase in temperature \
\bigcirc increase emissions leads to an increase of co2 in the atmosphere which may be the cause of the increase in temperature \
\bigcirc increase emissions leads to an increase of co2 in the atmosphere which may be the cause for the decrease in temperature
- Analyze each option:
- Option 1: Says "definitely causes", but in science, while CO₂ is a greenhouse gas, the relationship isn't absolute due to other factors (e.g., volcanic activity, solar cycles), so "definitely" is incorrect.
- Option 2: Increasing emissions can't lead to a decrease in atmospheric CO₂; this is factually wrong.
- Option 3: Increasing emissions add more CO₂ to the atmosphere. CO₂ is a greenhouse gas, so it may contribute to temperature increase (considering other variables, hence "may" is appropriate).
- Option 4: Increasing CO₂ (from emissions) would not cause a temperature decrease; this contradicts scientific understanding.
- So the correct option is the third one.

Snap & solve any problem in the app
Get step-by-step solutions on Sovi AI
Photo-based solutions with guided steps
Explore more problems and detailed explanations
C. increase emissions leads to an increase of CO2 in the atmosphere which may be the cause of the increase in temperature (assuming the third option is labeled C; if the original labels were different, adjust accordingly based on the options' order)