QUESTION IMAGE
Question
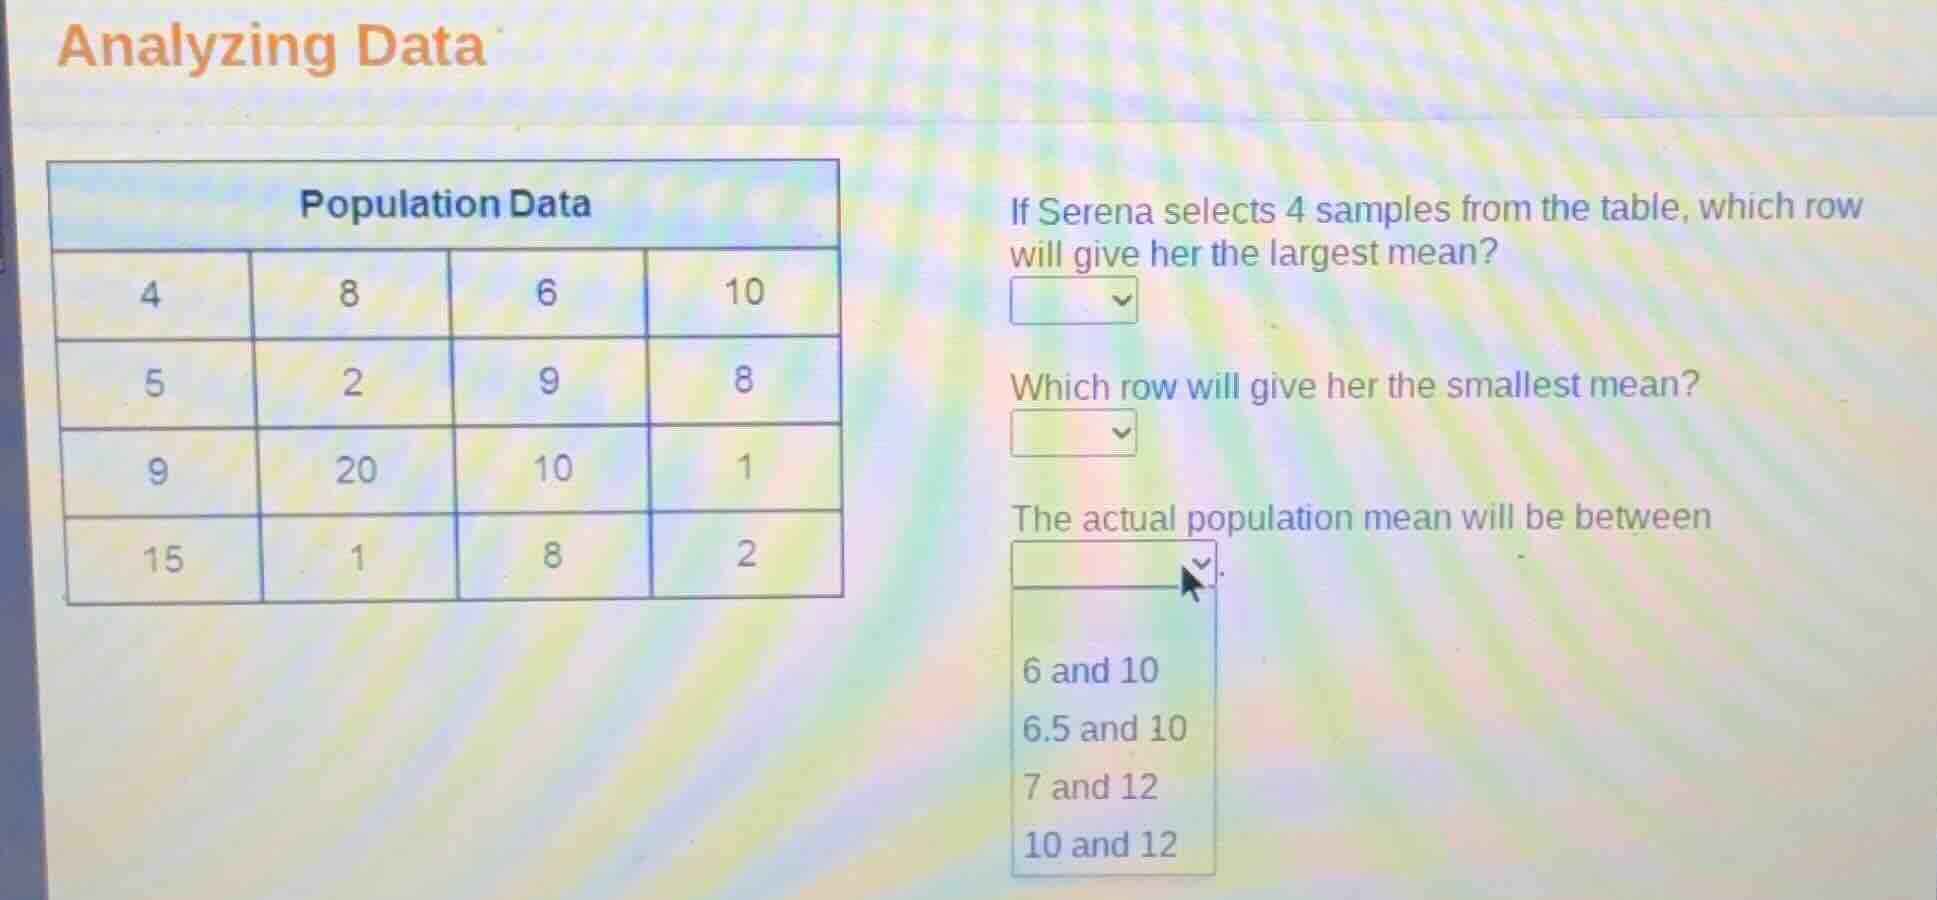
analyzing data
population data
4 8 6 10
5 2 9 8
9 20 10 1
15 1 8 2
if serena selects 4 samples from the table, which row will give her the largest mean?
which row will give her the smallest mean?
the actual population mean will be between
6 and 10
6.5 and 10
7 and 12
10 and 12
Step1: Calculate Row 1 mean
$\text{Mean}_1 = \frac{4+8+6+10}{4} = \frac{28}{4} = 7$
Step2: Calculate Row 2 mean
$\text{Mean}_2 = \frac{5+2+9+8}{4} = \frac{24}{4} = 6$
Step3: Calculate Row 3 mean
$\text{Mean}_3 = \frac{9+20+10+1}{4} = \frac{40}{4} = 10$
Step4: Calculate Row 4 mean
$\text{Mean}_4 = \frac{15+1+8+2}{4} = \frac{26}{4} = 6.5$
Step5: Find population mean
First sum all values: $4+8+6+10+5+2+9+8+9+20+10+1+15+1+8+2 = 118$
$\text{Population Mean} = \frac{118}{16} = 7.375$
Step6: Compare means for largest/smallest
Largest row mean = 10 (Row 3), Smallest row mean = 6 (Row 2)
Step7: Match population mean range
$7.375$ is between 6.5 and 10

Snap & solve any problem in the app
Get step-by-step solutions on Sovi AI
Photo-based solutions with guided steps
Explore more problems and detailed explanations
- Row with the largest mean: Row 3
- Row with the smallest mean: Row 2
- Population mean range: 6.5 and 10