QUESTION IMAGE
Question
analyzing data
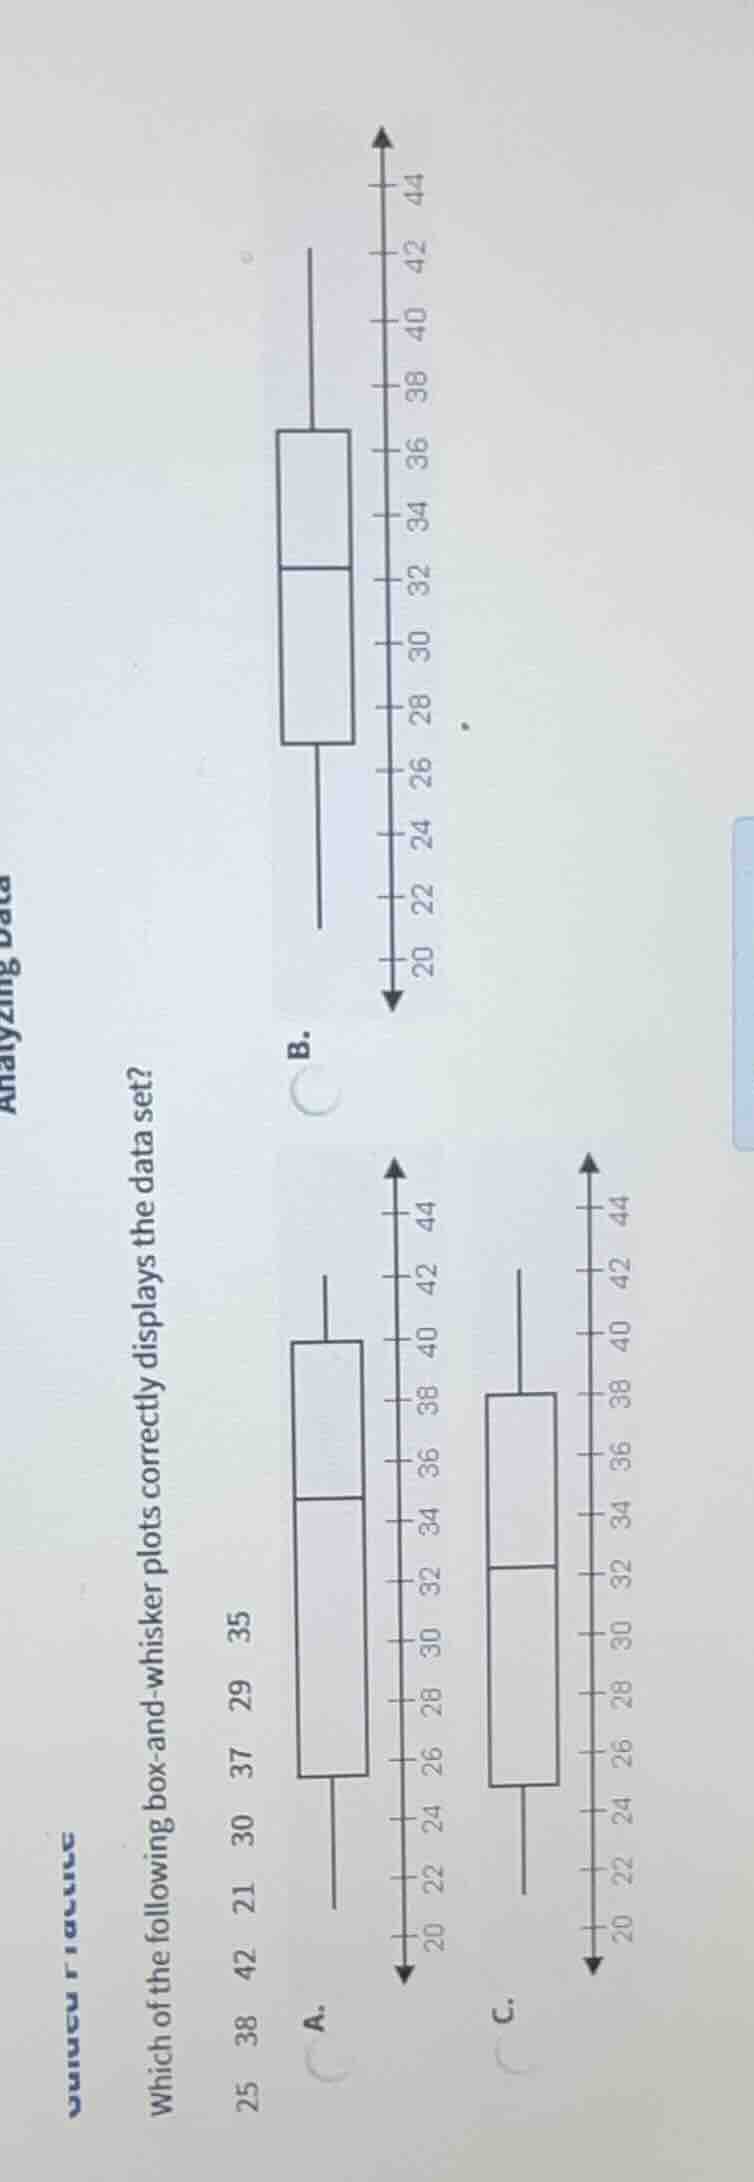
which of the following box - and - whisker plots correctly displays the data set?
25 38 42 21 30 37 29 35
a.
box - and - whisker plot a
b.
box - and - whisker plot b
c.
box - and - whisker plot c
Step1: Ordenar los datos
Ordenamos el conjunto: $21, 25, 29, 30, 35, 37, 38, 42$
Step2: Encontrar valores extremos
Mínimo = 21, Máximo = 42
Step3: Calcular la mediana
Como hay 8 datos, la mediana es el promedio del 4° y 5° valor:
$$\text{Mediana} = \frac{30 + 35}{2} = 32.5$$
Step4: Calcular Q1 y Q3
Q1 es la mediana de la mitad inferior ($21,25,29,30$):
$$Q1 = \frac{25 + 29}{2} = 27$$
Q3 es la mediana de la mitad superior ($35,37,38,42$):
$$Q3 = \frac{37 + 38}{2} = 37.5$$
Step5: Comparar con gráficos
El gráfico C coincide con estos valores: bigotes en 21 y 42, caja entre 27 y 37.5, línea de mediana en 32.5.

Snap & solve any problem in the app
Get step-by-step solutions on Sovi AI
Photo-based solutions with guided steps
Explore more problems and detailed explanations
C. The box-and-whisker plot with minimum 21, Q1=27, median=32, Q3=37.5, maximum=42