QUESTION IMAGE
Question
answer attempt 1 out of 5
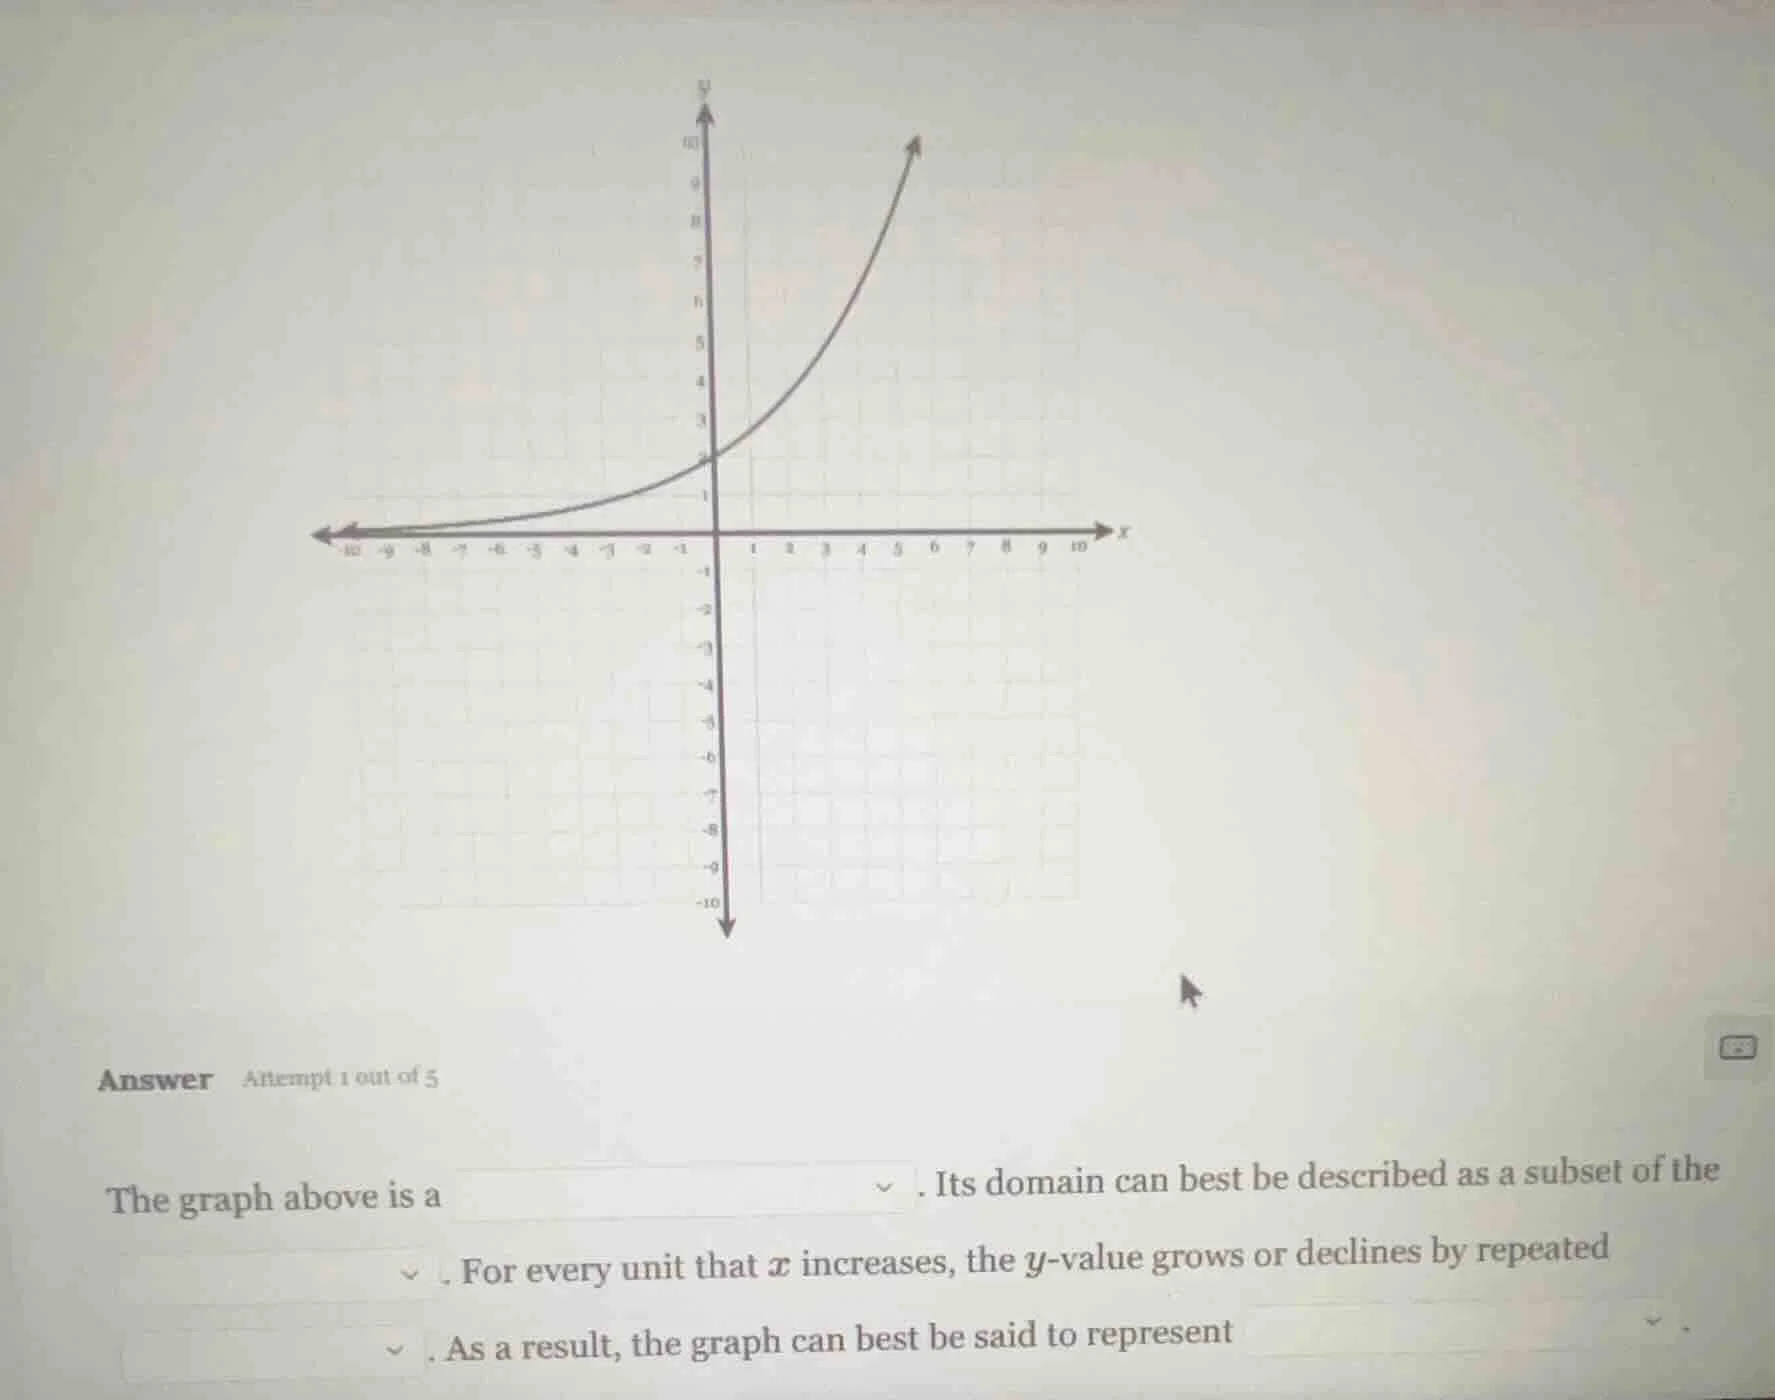
the graph above is a ✓ . its domain can best be described as a subset of the
✓ . for every unit that $x$ increases, the $y$-value grows or declines by repeated
✓ . as a result, the graph can best be said to represent ✓ .
The graph has a horizontal asymptote as \(x\) approaches negative infinity, passes through the point \((0,2)\), and grows exponentially as \(x\) increases. Exponential functions have the form \(y = ab^x\) where \(a>0, b>1\) for growth, match this shape. Their domain is all real numbers, and they change by a repeated multiplicative factor per unit \(x\) increase.

Snap & solve any problem in the app
Get step-by-step solutions on Sovi AI
Photo-based solutions with guided steps
Explore more problems and detailed explanations
The graph above is a exponential growth curve. Its domain can best be described as a subset of the real numbers. For every unit that \(x\) increases, the \(y\)-value grows or declines by repeated multiplication by a constant factor. As a result, the graph can best be said to represent exponential growth.