QUESTION IMAGE
Question
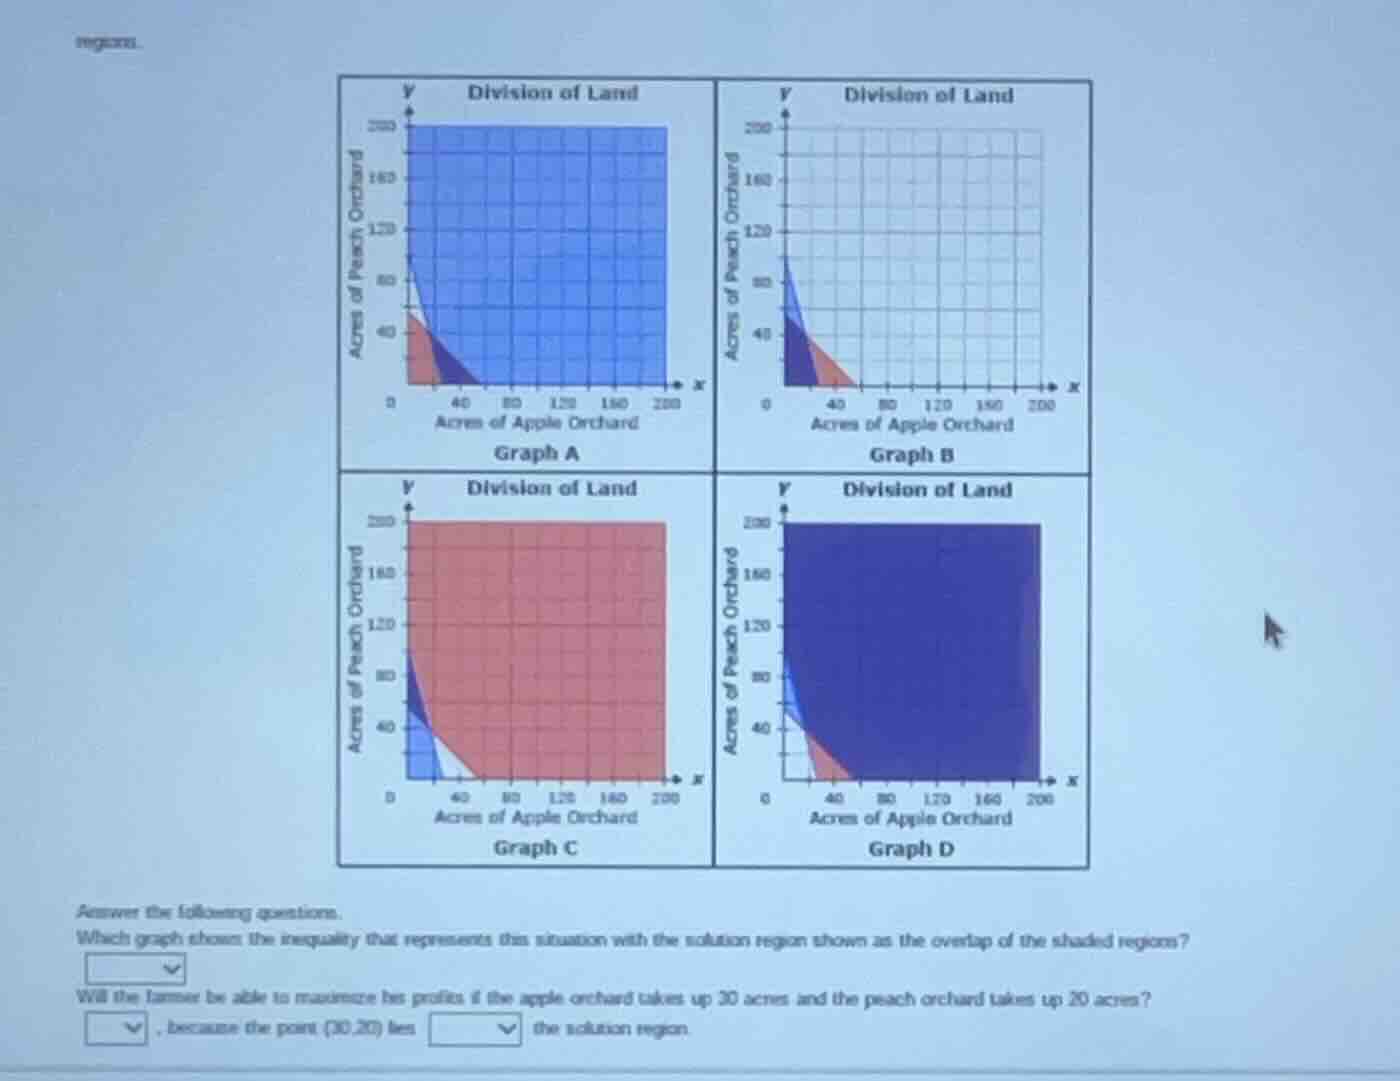
answer the following questions. which graph shows the inequality that represents the situation with the solution region shown as the overlap of the shaded regions? will the farmer be able to maximize her profits if the apple orchard takes up 30 acres and the peach orchard takes up 20 acres? , because the point (30,20) lies the solution region.
First Question (Which graph shows the inequality...):
To determine the graph with the solution region as the overlap of shaded regions, we analyze the overlap (intersection) of shaded areas. Graph B has two shaded regions (different colors) whose overlap is a small area, representing the solution region (intersection of inequalities). Other graphs have large single - colored regions or non - overlapping/incorrectly overlapping regions.
Step1: Analyze the point (30,20)
We need to check if (30,20) lies within the solution region (overlap) of Graph B.
Step2: Check the position of (30,20)
In Graph B, the solution region (overlap) includes the area where both inequalities are satisfied. The point (30,20) lies within the overlapping (solution) region of Graph B. So the farmer can maximize profits as (30,20) is in the solution region.

Snap & solve any problem in the app
Get step-by-step solutions on Sovi AI
Photo-based solutions with guided steps
Explore more problems and detailed explanations
B. Graph B