QUESTION IMAGE
Question
anthocyanin experiment
determining concentration
anthocyanins are red or purple-colored
molecules found in grapes, tart cherries,
and red kidney beans, among other foods.
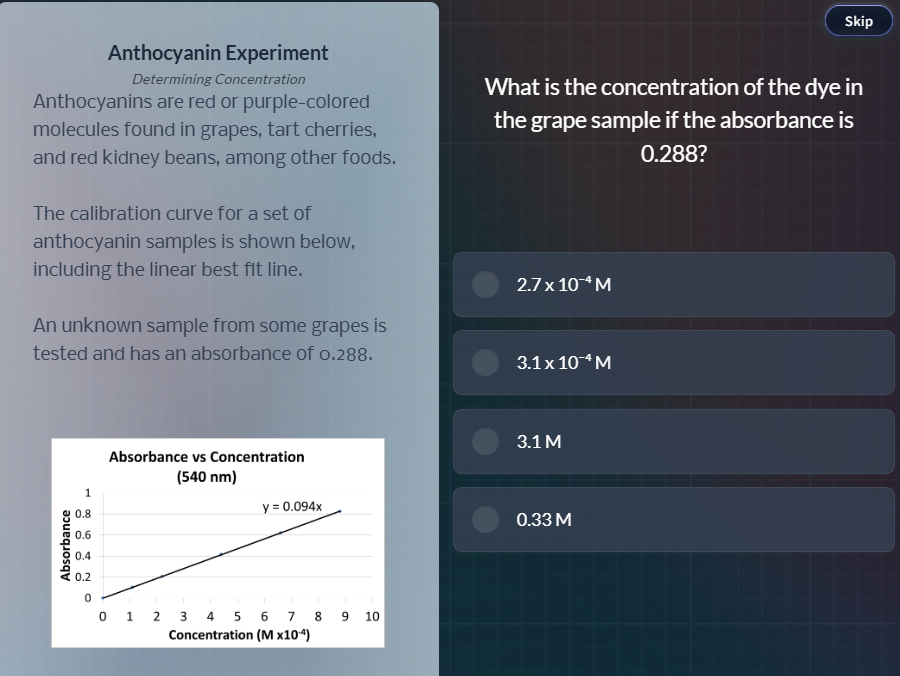
the calibration curve for a set of
anthocyanin samples is shown below,
including the linear best fit line.
an unknown sample from some grapes is
tested and has an absorbance of 0.288.
what is the concentration of the dye in
the grape sample if the absorbance is
0.288?
2.7 x 10⁻⁴ m
3.1 x 10⁻⁴ m
3.1 m
0.33 m
Step1: Identify calibration equation
The linear fit is $y = 0.094x$, where $y$ = absorbance, $x$ = concentration ($\text{M} \times 10^{-4}$).
Step2: Rearrange for concentration
Isolate $x$: $x = \frac{y}{0.094}$
Step3: Substitute absorbance value
Substitute $y=0.288$:
$x = \frac{0.288}{0.094} \approx 3.06$
This value is in $\text{M} \times 10^{-4}$, so concentration $\approx 3.1 \times 10^{-4}\text{M}$.

Snap & solve any problem in the app
Get step-by-step solutions on Sovi AI
Photo-based solutions with guided steps
Explore more problems and detailed explanations
3.1x10⁻⁴ M