QUESTION IMAGE
Question
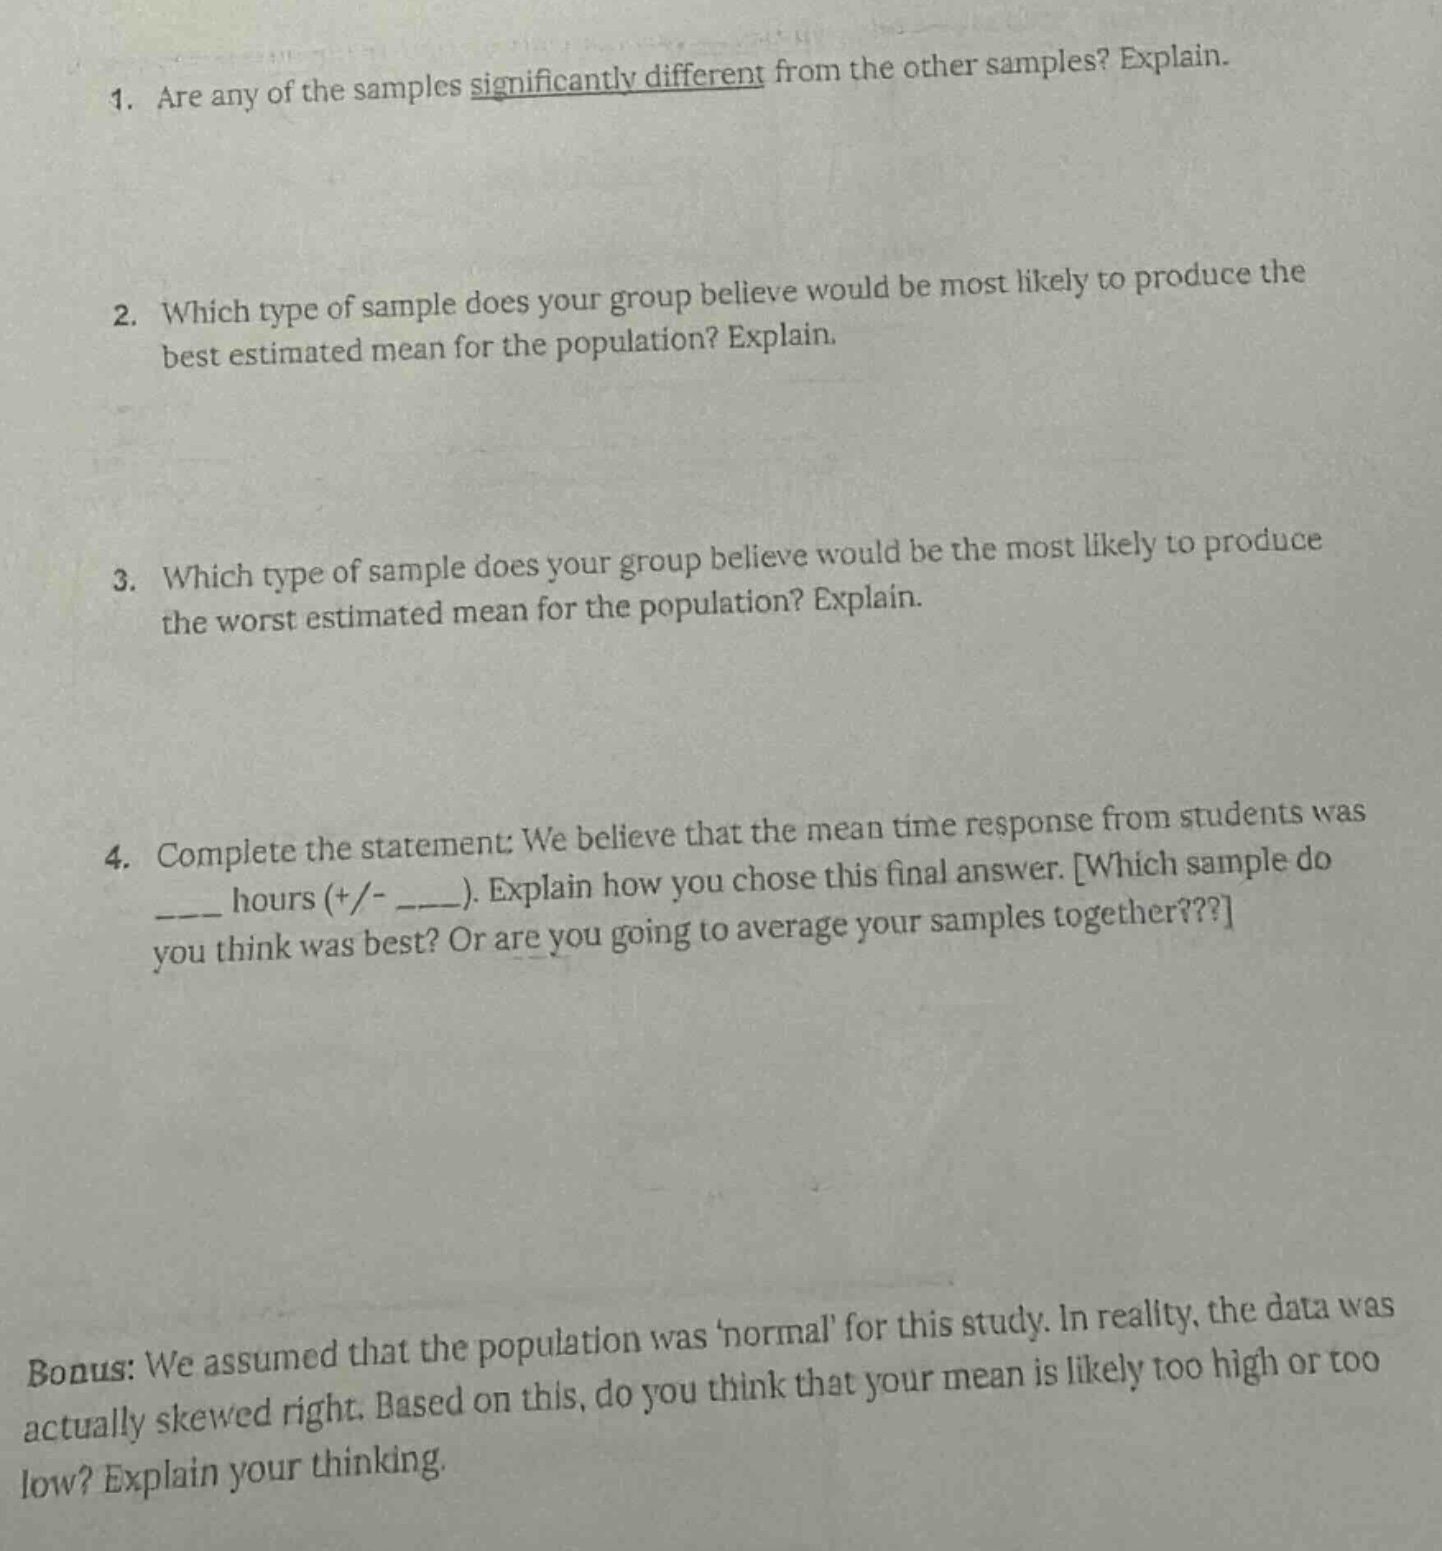
- are any of the samples significantly different from the other samples? explain.
- which type of sample does your group believe would be most likely to produce the best estimated mean for the population? explain.
- which type of sample does your group believe would be the most likely to produce the worst estimated mean for the population? explain.
- complete the statement: we believe that the mean time response from students was _ hours (+/- _). explain how you chose this final answer. which sample do you think was best? or are you going to average your samples together???
bonus: we assumed that the population was normal for this study. in reality, the data was actually skewed right. based on this, do you think that your mean is likely too high or too low? explain your thinking.
To answer these questions, we would typically need the actual data or details about the samples (e.g., sample types like random, stratified, convenience, etc., and their respective statistics like mean, standard deviation, sample size). Since the data is not provided, here's a general approach for each question:
1. Are any samples significantly different?
To determine this, we analyze the central tendency (mean, median) and variability (standard deviation, range) of each sample. If a sample’s mean (or median) is far from others (e.g., using a t - test for two samples or ANOVA for multiple samples to check for significant differences), it may be “significantly different.” Without data, we can’t calculate, but the process involves:
- Step 1: Calculate descriptive stats (mean, SD, n) for each sample.
- Step 2: Use statistical tests (e.g., t - test, ANOVA) to compare means.
- Step 3: Check p - values (or effect sizes) to determine significance.
2. Best sample for population mean estimation
The “best” sample is typically a random sample (or stratified random) because it minimizes bias. Random sampling ensures each population member has an equal chance of being selected, so the sample is more likely to represent the population. Other considerations:
- Larger sample size (more data = better estimation, by the Central Limit Theorem).
- Low variability (consistent data reduces error in the mean).
3. Worst sample for population mean estimation
A convenience sample (e.g., sampling friends, people in one location) is often worst. Convenience samples are biased (they don’t represent the entire population) because they rely on easy - to - reach participants. Other biased samples (e.g., voluntary response, self - selected) also produce poor estimates.
4. Completing the mean statement
To estimate the population mean:
- Choose the “best” sample (e.g., random, large n, low SD).
- Calculate its mean (e.g., $\bar{x}=\frac{\sum x}{n}$) and margin of error (e.g., $ME = t_{\alpha/2}\frac{s}{\sqrt{n}}$ for small samples, or $ME = z_{\alpha/2}\frac{\sigma}{\sqrt{n}}$ for large samples).
- Report: “We believe the mean time response was $\boldsymbol{\bar{x}}$ hours (+/ - $\boldsymbol{ME}$ hours), chosen because [sample type] minimized bias/had low variability/was representative.”
Bonus: Skewed right population
A right - skewed population has a long tail on the right (high - value outliers). The mean is pulled up by the tail, while the median is less affected. If we assumed normality (symmetric) but the population is skewed right:
- Our estimated mean (from a sample) is likely too high if the sample included outliers (since the mean is sensitive to skewness). The median would be a better measure for skewed data, but if we used the mean (assuming normality), it overestimates the “typical” value.
Without the actual sample data, these are general frameworks. To provide specific answers, share the sample details (types, sizes, means, SDs, etc.).

Snap & solve any problem in the app
Get step-by-step solutions on Sovi AI
Photo-based solutions with guided steps
Explore more problems and detailed explanations
To answer these questions, we would typically need the actual data or details about the samples (e.g., sample types like random, stratified, convenience, etc., and their respective statistics like mean, standard deviation, sample size). Since the data is not provided, here's a general approach for each question:
1. Are any samples significantly different?
To determine this, we analyze the central tendency (mean, median) and variability (standard deviation, range) of each sample. If a sample’s mean (or median) is far from others (e.g., using a t - test for two samples or ANOVA for multiple samples to check for significant differences), it may be “significantly different.” Without data, we can’t calculate, but the process involves:
- Step 1: Calculate descriptive stats (mean, SD, n) for each sample.
- Step 2: Use statistical tests (e.g., t - test, ANOVA) to compare means.
- Step 3: Check p - values (or effect sizes) to determine significance.
2. Best sample for population mean estimation
The “best” sample is typically a random sample (or stratified random) because it minimizes bias. Random sampling ensures each population member has an equal chance of being selected, so the sample is more likely to represent the population. Other considerations:
- Larger sample size (more data = better estimation, by the Central Limit Theorem).
- Low variability (consistent data reduces error in the mean).
3. Worst sample for population mean estimation
A convenience sample (e.g., sampling friends, people in one location) is often worst. Convenience samples are biased (they don’t represent the entire population) because they rely on easy - to - reach participants. Other biased samples (e.g., voluntary response, self - selected) also produce poor estimates.
4. Completing the mean statement
To estimate the population mean:
- Choose the “best” sample (e.g., random, large n, low SD).
- Calculate its mean (e.g., $\bar{x}=\frac{\sum x}{n}$) and margin of error (e.g., $ME = t_{\alpha/2}\frac{s}{\sqrt{n}}$ for small samples, or $ME = z_{\alpha/2}\frac{\sigma}{\sqrt{n}}$ for large samples).
- Report: “We believe the mean time response was $\boldsymbol{\bar{x}}$ hours (+/ - $\boldsymbol{ME}$ hours), chosen because [sample type] minimized bias/had low variability/was representative.”
Bonus: Skewed right population
A right - skewed population has a long tail on the right (high - value outliers). The mean is pulled up by the tail, while the median is less affected. If we assumed normality (symmetric) but the population is skewed right:
- Our estimated mean (from a sample) is likely too high if the sample included outliers (since the mean is sensitive to skewness). The median would be a better measure for skewed data, but if we used the mean (assuming normality), it overestimates the “typical” value.
Without the actual sample data, these are general frameworks. To provide specific answers, share the sample details (types, sizes, means, SDs, etc.).