QUESTION IMAGE
Question
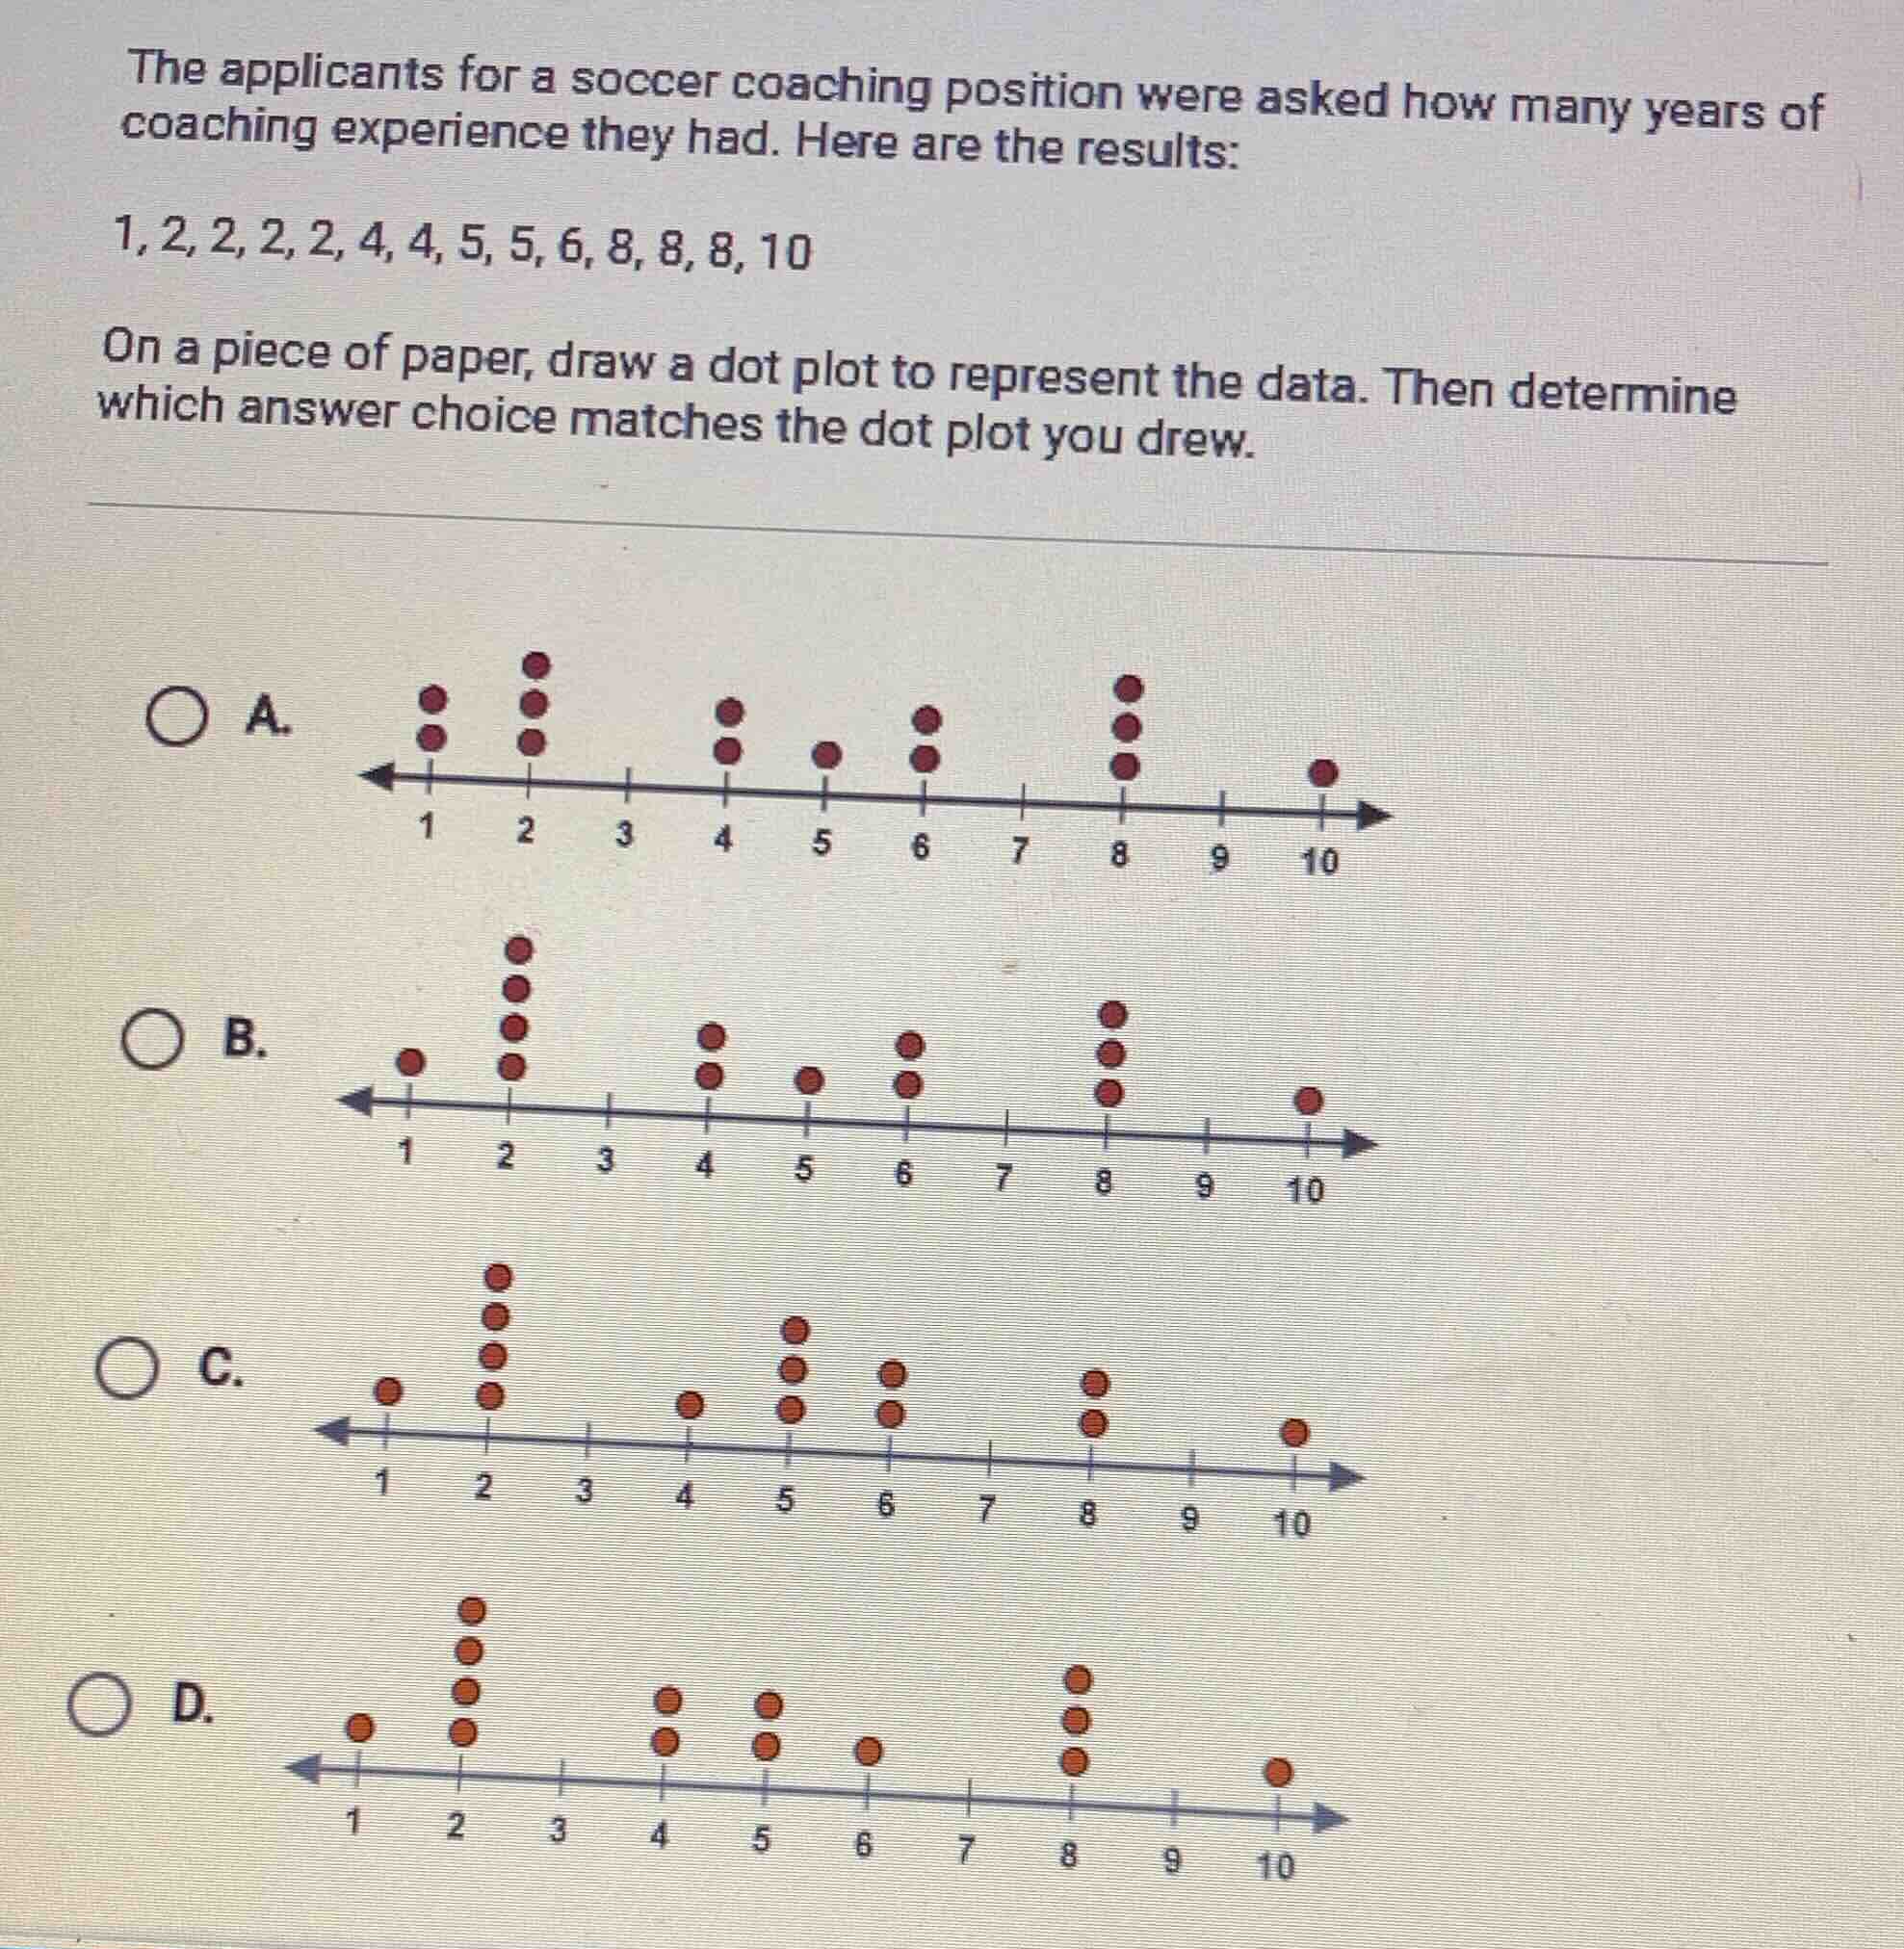
the applicants for a soccer coaching position were asked how many years of coaching experience they had. here are the results:
1, 2, 2, 2, 2, 4, 4, 5, 5, 6, 8, 8, 8, 10
on a piece of paper, draw a dot plot to represent the data. then determine which answer choice matches the dot plot you drew.
a.
b.
c.
d.
Step1: Count data frequencies
1: 1, 2: 4, 4: 2, 5: 2, 6: 1, 8: 3, 10: 1
Step2: Match to dot plot
Compare counts to each option's dot counts per value.

Snap & solve any problem in the app
Get step-by-step solutions on Sovi AI
Photo-based solutions with guided steps
Explore more problems and detailed explanations
B. <The dot plot with 1 dot at 1, 4 dots at 2, 2 dots at 4, 2 dots at 5, 1 dot at 6, 3 dots at 8, 1 dot at 10>