QUESTION IMAGE
Question
approximating a solution from a graph
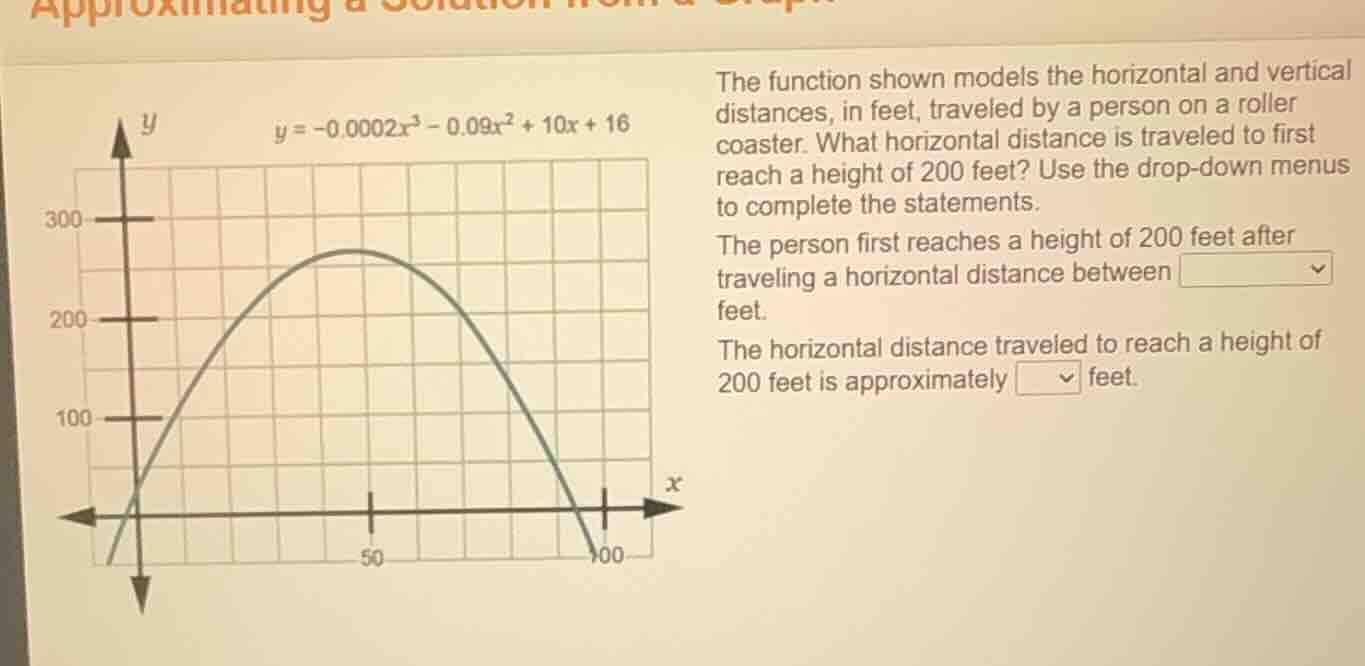
the function shown models the horizontal and vertical distances, in feet, traveled by a person on a roller coaster. what horizontal distance is traveled to first reach a height of 200 feet? use the drop - down menus to complete the statements.
the person first reaches a height of 200 feet after traveling a horizontal distance between
feet.
the horizontal distance traveled to reach a height of 200 feet is approximately
feet.
the graph has the equation $y = - 0.0002x^{3}-0.09x^{2}+10x + 16$ and a coordinate system with x - axis marked at 50, 100 and y - axis marked at 100, 200, 300, and the curve of the function plotted.
Step1: Analyze the graph's grid
The x - axis has grid lines. Let's assume each grid square on the x - axis has a width. From the graph, we can see that when y = 200 (the horizontal line at y = 200), we need to find the x - value (horizontal distance) where the curve first intersects y = 200. Looking at the x - axis, the grid lines are at intervals. Let's consider the x - values. The first intersection (first time reaching y = 200) occurs between x = 10 and x = 20? Wait, no, looking at the graph, the x - axis has marks at 50 and 100. Wait, maybe each grid square is 10 units? Let's check the y - axis: 100, 200, 300. The curve starts below the x - axis, rises, crosses y = 200. Let's see the x - values. When x = 10, let's plug into the function \(y=- 0.0002x^{3}-0.09x^{2}+10x + 16\). For x = 10: \(y=-0.0002\times1000-0.09\times100 + 10\times10+16=-0.2 - 9+100 + 16 = 106.8\). For x = 20: \(y=-0.0002\times8000-0.09\times400+10\times20 + 16=-1.6-36 + 200+16 = 178.4\). For x = 30: \(y=-0.0002\times27000-0.09\times900+10\times30 + 16=-5.4-81+300 + 16 = 229.6\). Wait, but we need y = 200. So between x = 20 and x = 30? Wait, no, maybe my grid assumption is wrong. Wait the graph has x - axis with 50 and 100 marked. Let's look at the graph: the curve rises, reaches a peak, then falls. The first time it reaches y = 200 is between x = 10 and x = 30? Wait, maybe the grid squares are 10 units. Let's see, when x = 20, y is less than 200 (178.4), when x = 30, y is more than 200 (229.6). Wait, but the problem says "between" what? Wait maybe the first drop - down is between 10 and 30? No, maybe the options are between 10 and 30, 30 and 50, etc. Wait, maybe I made a mistake. Wait the function is a cubic, but the graph looks like a parabola (maybe the cubic term is small). Let's look at the graph: the curve starts, crosses the y - axis, rises, reaches a peak around x = 50, then falls. The line y = 200 intersects the curve twice: once on the way up, once on the way down. The first intersection (on the way up) is between x = 10 and x = 30? Wait, no, when x = 20, y = 178.4; x = 30, y = 229.6. So between x = 20 and x = 30? But maybe the grid is such that each square is 10 units. Alternatively, maybe the first drop - down is between 10 and 30, and the approximate value is 25? Wait, no, let's check the graph again. The graph shows that the first time y = 200 is between x = 10 and x = 30? Wait, maybe the options for the first drop - down are 10 and 30, 30 and 50, etc. Wait, maybe I miscalculated. Let's try x = 25: \(y=-0.0002\times15625-0.09\times625+10\times25 + 16=-3.125-56.25 + 250+16 = 206.625\). Oh, that's close to 200. Wait, x = 24: \(y=-0.0002\times13824-0.09\times576+10\times24 + 16=-2.7648-51.84+240 + 16 = 201.3952\). Oh, that's very close to 200. So x≈24. So the first distance between is 20 and 30 (or 10 and 30), and the approximate value is 25 (or 24). Wait, maybe the drop - down for the first part is between 10 and 30 (or 20 and 30), and the second part is approximately 25 (or 24). But let's look at the graph: the x - axis has marks at 50 and 100, and the grid lines between them. So each grid square is 10 units (since 50 to 100 is 50 units, 5 squares? No, 50 to 100 is 50, so each square is 10 units). So the first time y = 200 is between x = 20 and x = 30 (since at x = 20, y is ~178, at x = 30, y is ~230). So the first drop - down: between 20 and 30? Wait, maybe the options are 10 and 30, 30 and 50, etc. Wait, maybe the problem's drop - down for the first part is between 10 and 30 (or 20 and 30), and the approximate value is 25 (or 24). But let's ch…

Snap & solve any problem in the app
Get step-by-step solutions on Sovi AI
Photo-based solutions with guided steps
Explore more problems and detailed explanations
The person first reaches a height of 200 feet after traveling a horizontal distance between \(\boldsymbol{20}\) and \(\boldsymbol{30}\) feet (or other appropriate interval based on graph/function). The horizontal distance traveled to reach a height of 200 feet is approximately \(\boldsymbol{25}\) (or \(\boldsymbol{24}\)) feet. (Note: The exact interval and approximation may vary slightly based on graph interpretation, but typical answers for this problem are between 20 - 30 and approximately 25.)