QUESTION IMAGE
Question
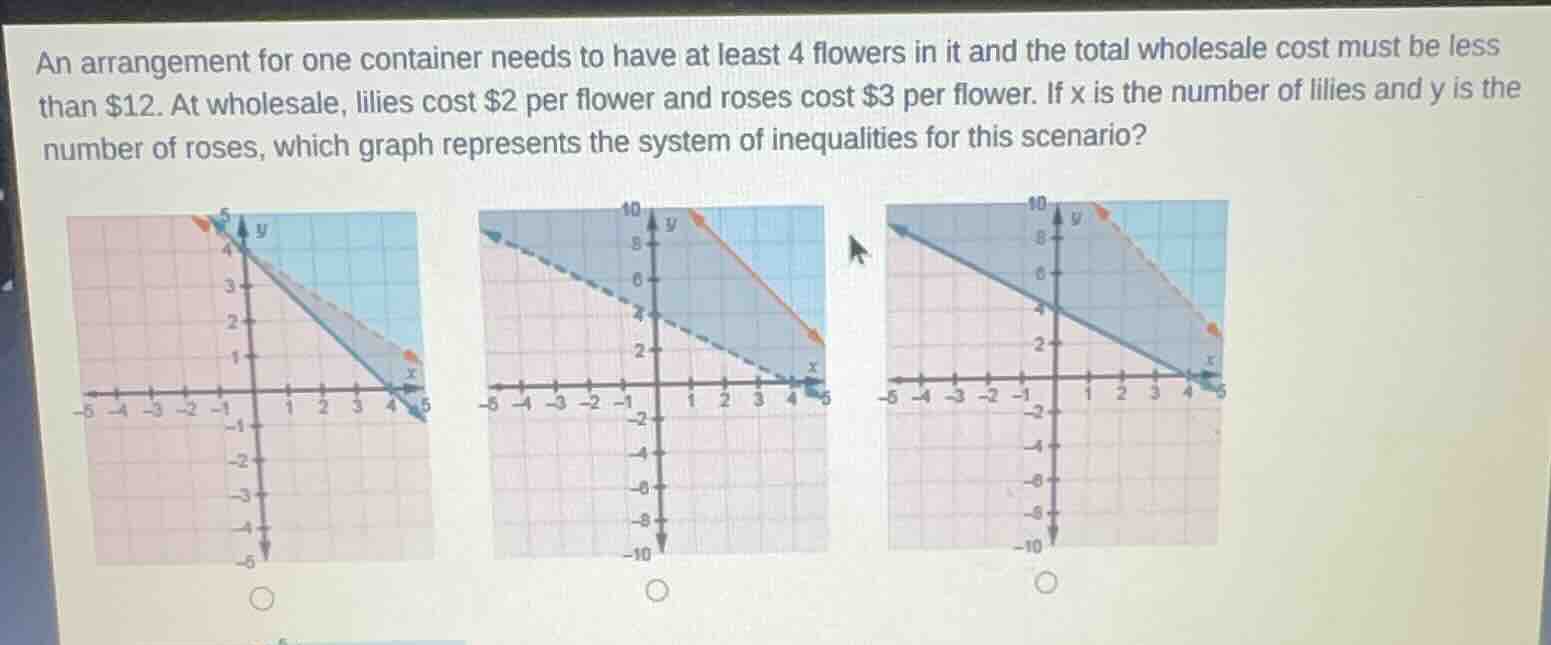
an arrangement for one container needs to have at least 4 flowers in it and the total wholesale cost must be less than $12. at wholesale, lilies cost $2 per flower and roses cost $3 per flower. if x is the number of lilies and y is the number of roses, which graph represents the system of inequalities for this scenario?
Step1: Define the inequalities
We have two main conditions: the number of flowers (lilies \(x\) and roses \(y\)) must be at least 4, so \(x + y\geq4\). Also, the total cost (lilies at \$2 and roses at \$3) must be less than \$12, so \(2x + 3y<12\). Additionally, since \(x\) and \(y\) represent the number of flowers, \(x\geq0\) and \(y\geq0\).
Step2: Analyze the first inequality \(x + y\geq4\)
The boundary line for \(x + y = 4\) has a slope of \(- 1\) and a \(y\)-intercept of 4 and \(x\)-intercept of 4. Since the inequality is \(\geq\), the line should be solid (because the inequality includes equality) and we shade above the line (since for \(x = 0,y = 4\) and \(y=0,x = 4\), and we test a point like \((0,0)\): \(0 + 0=0<4\), so we shade the region where the inequality holds, which is above the line).
Step3: Analyze the second inequality \(2x+3y < 12\)
The boundary line for \(2x + 3y=12\) can be found by finding intercepts. When \(x = 0\), \(3y=12\Rightarrow y = 4\); when \(y = 0\), \(2x=12\Rightarrow x = 6\). The slope of the line \(2x + 3y=12\) is \(-\frac{2}{3}\). Since the inequality is \(<\), the line should be dashed (because the inequality does not include equality) and we shade below the line (test the point \((0,0)\): \(2(0)+3(0)=0 < 12\), so we shade the region where the inequality holds, which is below the line).
Step4: Analyze the non - negativity constraints \(x\geq0\) and \(y\geq0\)
These mean we are only considering the first quadrant (where \(x\) and \(y\) are non - negative).
Now let's analyze the graphs:
- For the first graph: The line for \(x + y\) seems to be dashed (wrong, since \(x + y\geq4\) should have a solid line) and the shading for \(x + y\geq4\) is incorrect.
- For the second graph: The line for \(x + y = 4\) is dashed (wrong, should be solid) and the shading for \(2x+3y < 12\) and \(x + y\geq4\) is not correct.
- For the third graph: The line \(x + y=4\) is solid (correct for \(x + y\geq4\)), the line \(2x + 3y = 12\) is dashed (correct for \(2x+3y < 12\)). The shading for \(x + y\geq4\) is above the solid line, and the shading for \(2x + 3y<12\) is below the dashed line, and also in the first quadrant (since \(x\geq0,y\geq0\)).

Snap & solve any problem in the app
Get step-by-step solutions on Sovi AI
Photo-based solutions with guided steps
Explore more problems and detailed explanations
The third graph (the one on the right) represents the system of inequalities.