QUESTION IMAGE
Question
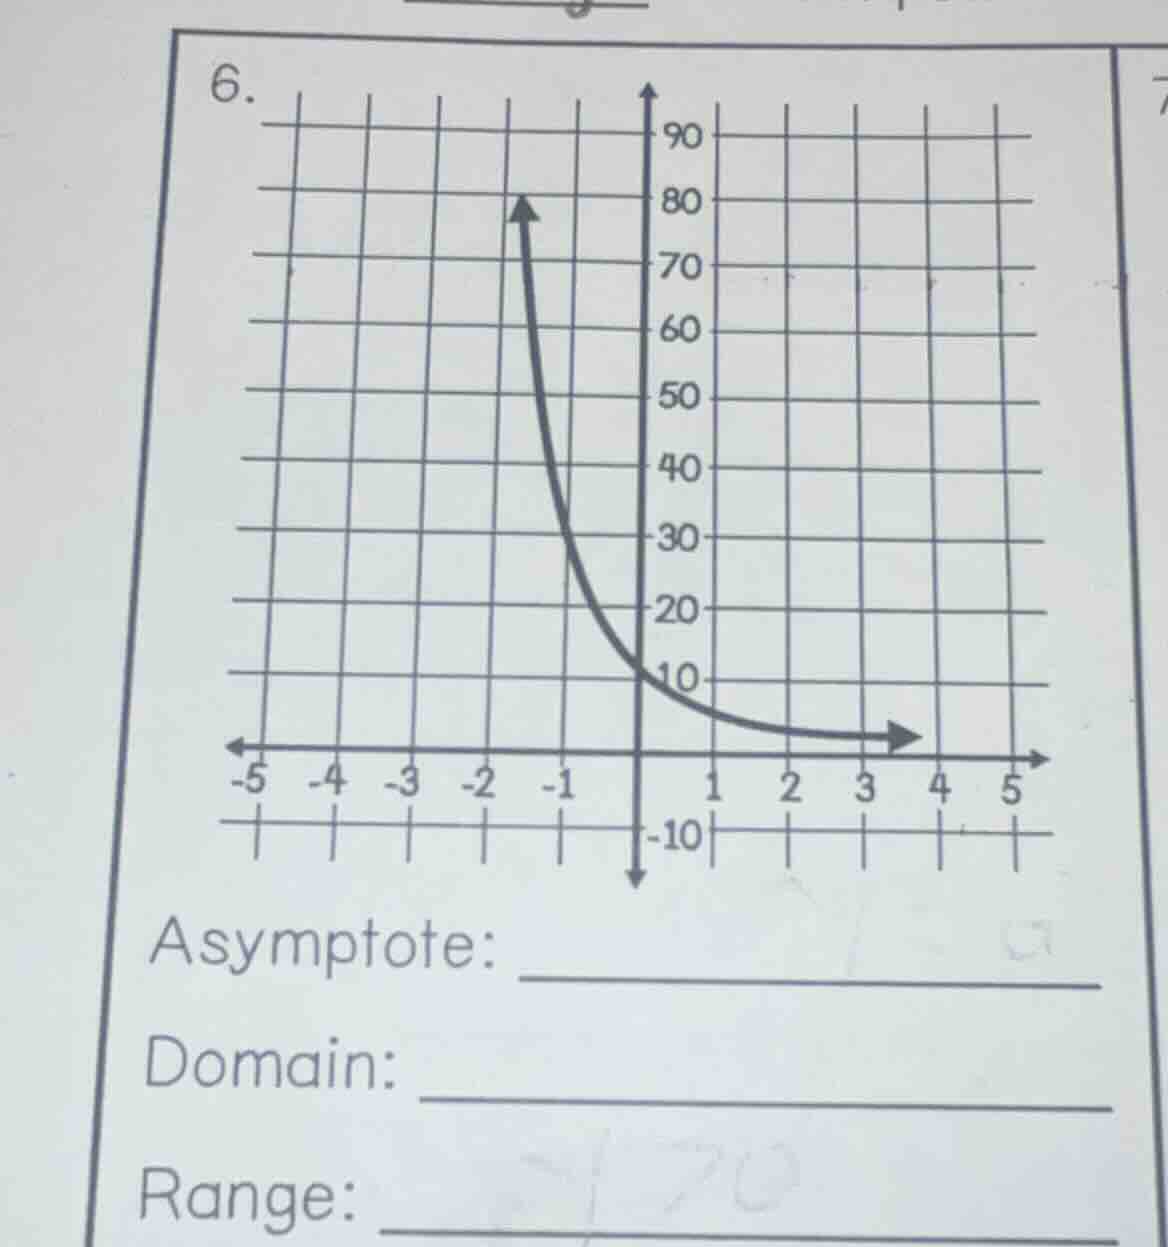
6.
asymptote:
domain:
range:
Step1: Analyze the Asymptote
The graph appears to be an exponential decay function (or a similar curve) that approaches the x - axis (y = 0) as x increases and goes to positive infinity as x approaches - 2 from the right? Wait, no, looking at the horizontal asymptote. The curve gets closer and closer to y = 0 as x increases (for the right - hand part) and for the left - hand part, as x approaches - 2 from the right, it goes to infinity? Wait, no, the horizontal asymptote: the graph seems to approach y = 0 as x→∞ (the right - hand side of the graph is approaching the x - axis, which is y = 0). Also, looking at the vertical asymptote: the graph has a vertical asymptote at x=-2? Wait, no, the graph is defined for x > - 2? Wait, no, let's re - examine. The graph is a curve that, on the left side (x approaching - 2 from the right), goes up to infinity, and on the right side (x> - 2), it decreases towards y = 0. Wait, no, the x - axis is y = 0, and the graph approaches y = 0 as x→∞. So the horizontal asymptote is y = 0. The vertical asymptote: looking at the graph, the curve has a vertical asymptote at x=-2? Wait, the x - values: the graph is drawn from x > - 2 (since at x=-2, the graph goes to infinity). Wait, no, the grid lines: the x - axis has marks at - 5, - 4, - 3, - 2, - 1, 0, 1, 2, 3, 4, 5. The curve is on the right side of x=-2 (since at x=-2, the arrow is going up, meaning the function has a vertical asymptote at x = - 2.
Step2: Analyze the Domain
The domain is the set of all x - values for which the function is defined. From the graph, the function is defined for all real numbers x such that x > - 2 (because to the left of x=-2, there is no graph, and at x=-2, the function approaches infinity, so the domain is x∈(-2, ∞) or all real numbers greater than - 2.
Step3: Analyze the Range
The range is the set of all y - values the function takes. The graph goes from y = 0 (as a horizontal asymptote, not including 0) up to positive infinity. So the range is y∈(0, ∞) or all real numbers greater than 0.
Wait, maybe I made a mistake. Let's re - check the horizontal asymptote. The right - hand side of the graph approaches the x - axis (y = 0) as x increases, so the horizontal asymptote is y = 0. The vertical asymptote: the graph has a vertical asymptote at x=-2 because as x approaches - 2 from the right, the function values go to positive infinity.
For the domain: the function is defined for all x where x > - 2 (since at x=-2, the function is undefined, and to the left of x=-2, there is no graph), so domain is (-2, ∞).
For the range: the function takes all positive real numbers because it goes from just above y = 0 (approaching 0 as x→∞) up to positive infinity (as x approaches - 2 from the right), so range is (0, ∞).
But let's confirm the asymptote first. The horizontal asymptote: as x→∞, y→0, so horizontal asymptote is y = 0. The vertical asymptote: as x→ - 2⁺ (x approaches - 2 from the right), y→∞, so vertical asymptote is x=-2.

Snap & solve any problem in the app
Get step-by-step solutions on Sovi AI
Photo-based solutions with guided steps
Explore more problems and detailed explanations
Asymptote: Horizontal asymptote \( y = 0 \), Vertical asymptote \( x=-2 \)
Domain: All real numbers \( x > - 2 \) (or \( (-2,\infty) \))
Range: All real numbers \( y > 0 \) (or \( (0,\infty) \))
(If we consider only the horizontal asymptote as the main asymptote asked (since the question says "Asymptote" without specifying horizontal or vertical, but usually for such graphs, the horizontal asymptote is more prominent in the context of exponential - like graphs). So if we take the horizontal asymptote: \( y = 0 \), domain: \( (-2,\infty) \), range: \( (0,\infty) \))