QUESTION IMAGE
Question
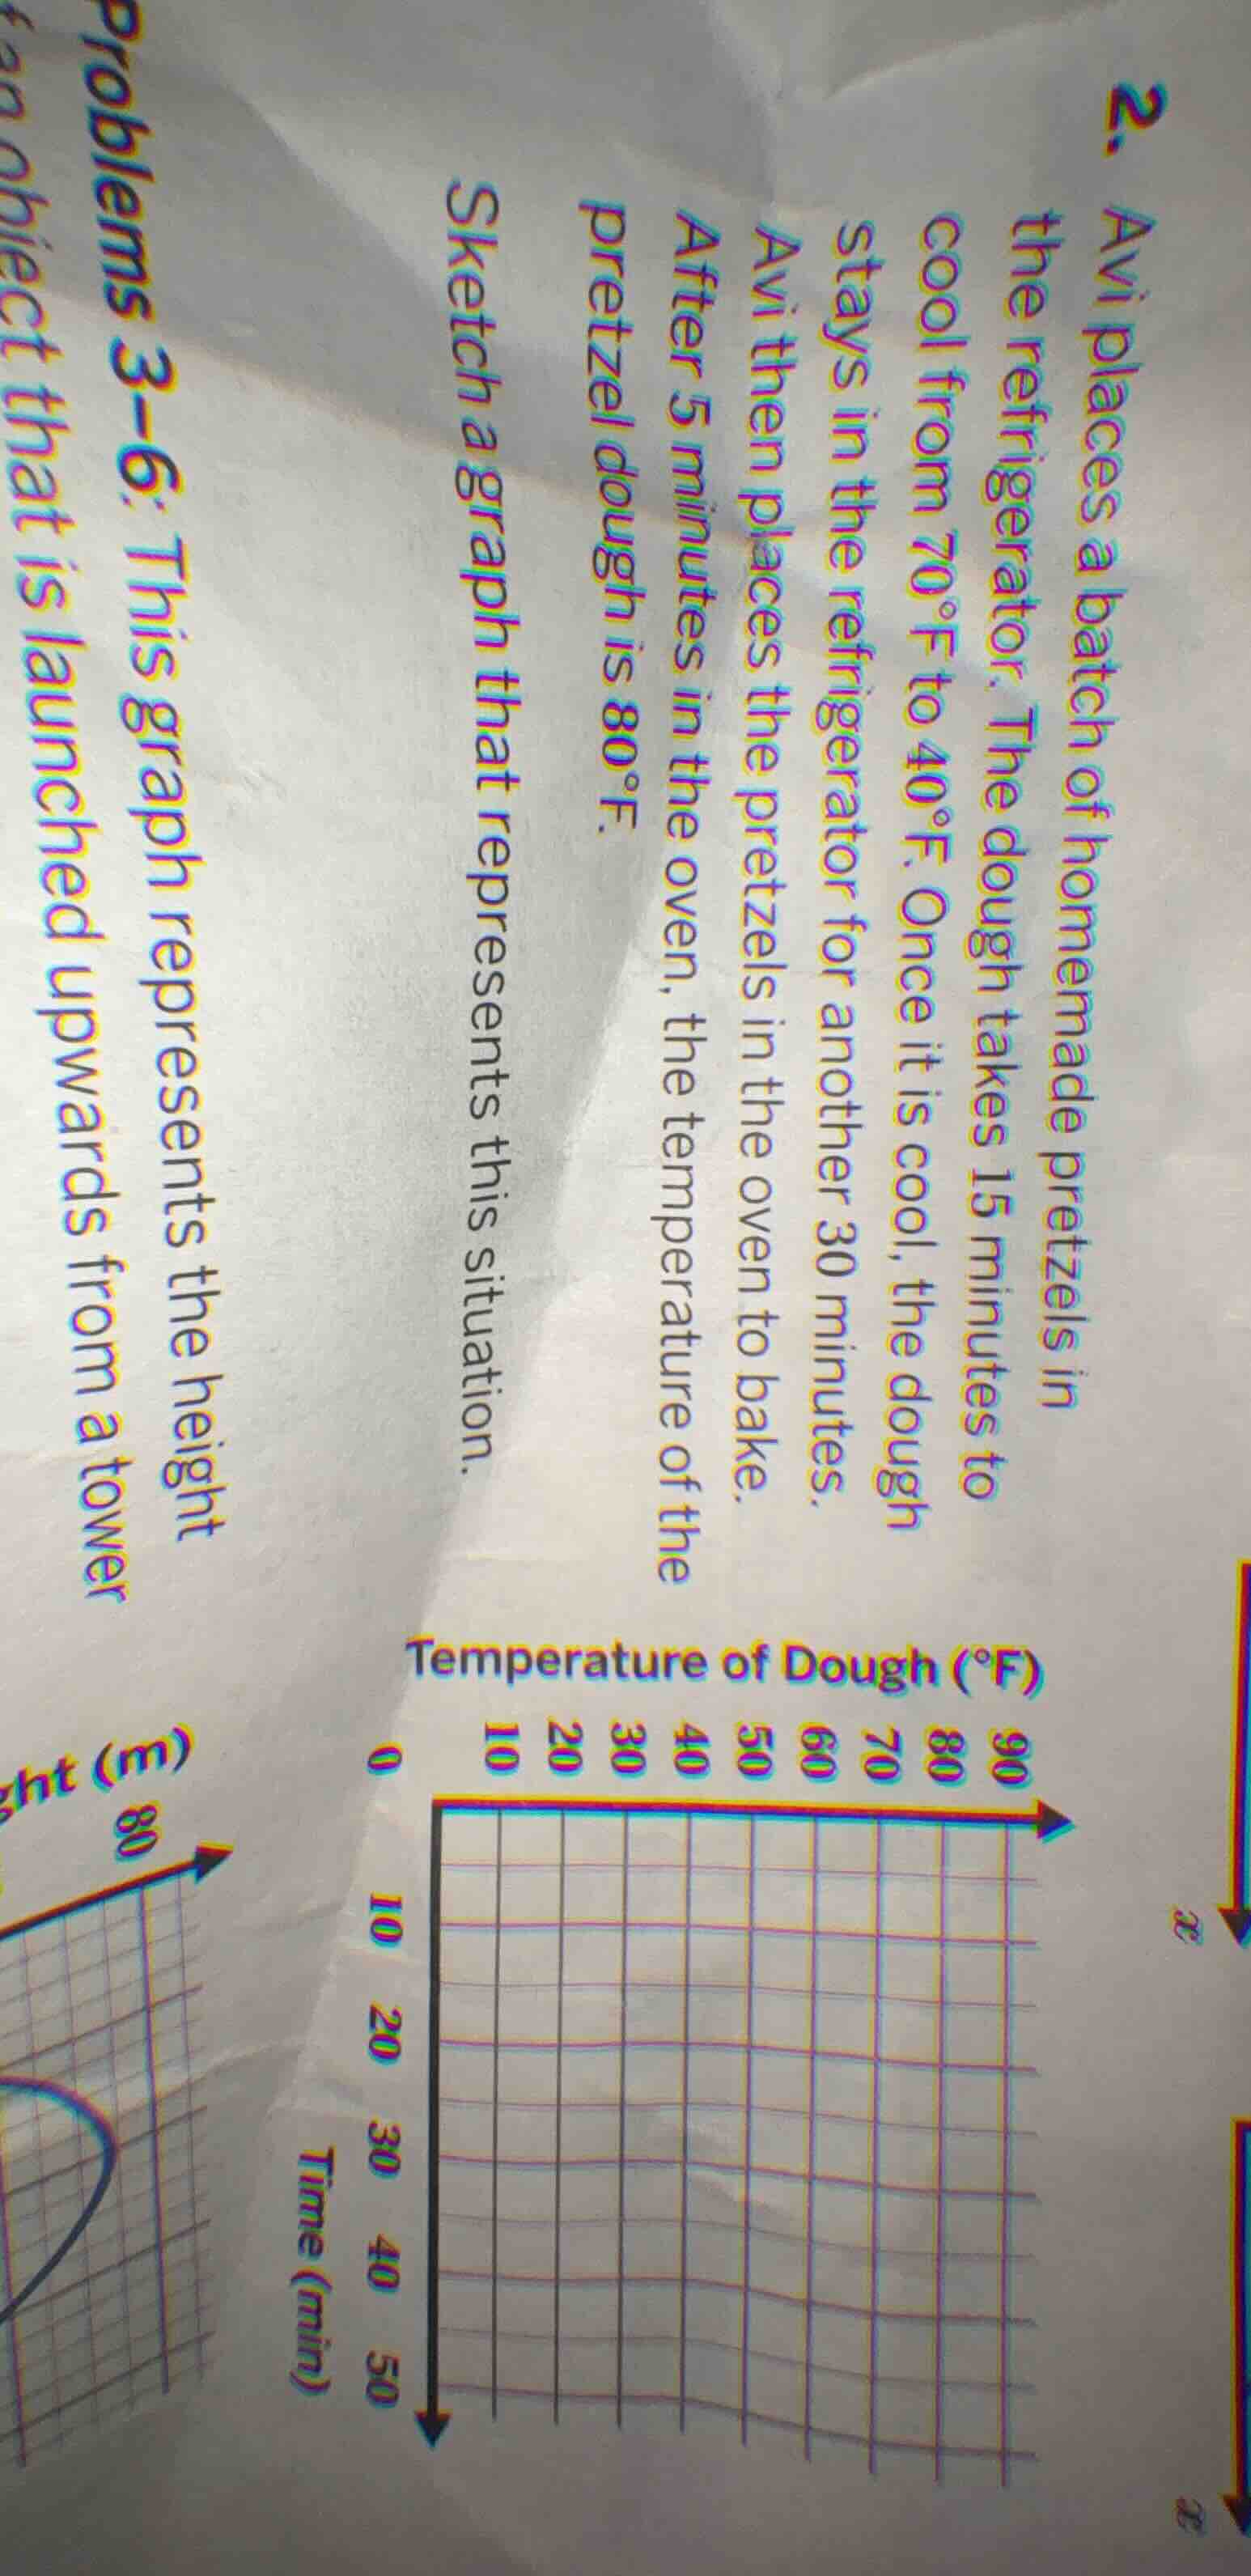
- avi places a batch of homemade pretzels in the refrigerator. the dough takes 15 minutes to cool from 70°f to 40°f. once it is cool, the dough stays in the refrigerator for another 30 minutes. avi then places the pretzels in the oven to bake. after 5 minutes in the oven, the temperature of the pretzel dough is 80°f. sketch a graph that represents this situation.
Step1: Define initial state
Start at time $t=0$, temperature $T=70^\circ\text{F}$.
Step2: Plot cooling phase (0-15 min)
Line from $(0, 70)$ to $(15, 40)$ (cools to $40^\circ\text{F}$ over 15 min).
Step3: Plot holding phase (15-45 min)
Horizontal line from $(15, 40)$ to $(45, 40)$ (stays at $40^\circ\text{F}$ for 30 min).
Step4: Plot heating phase (45-50 min)
Line from $(45, 40)$ to $(50, 80)$ (heats to $80^\circ\text{F}$ over 5 min).

Snap & solve any problem in the app
Get step-by-step solutions on Sovi AI
Photo-based solutions with guided steps
Explore more problems and detailed explanations
The graph has the following segments:
- A decreasing line from $(0, 70)$ to $(15, 40)$
- A horizontal line from $(15, 40)$ to $(45, 40)$
- An increasing line from $(45, 40)$ to $(50, 80)$
(When drawn on the provided grid, these points align with the time (y-axis) and temperature (x-axis) scales.)