QUESTION IMAGE
Question
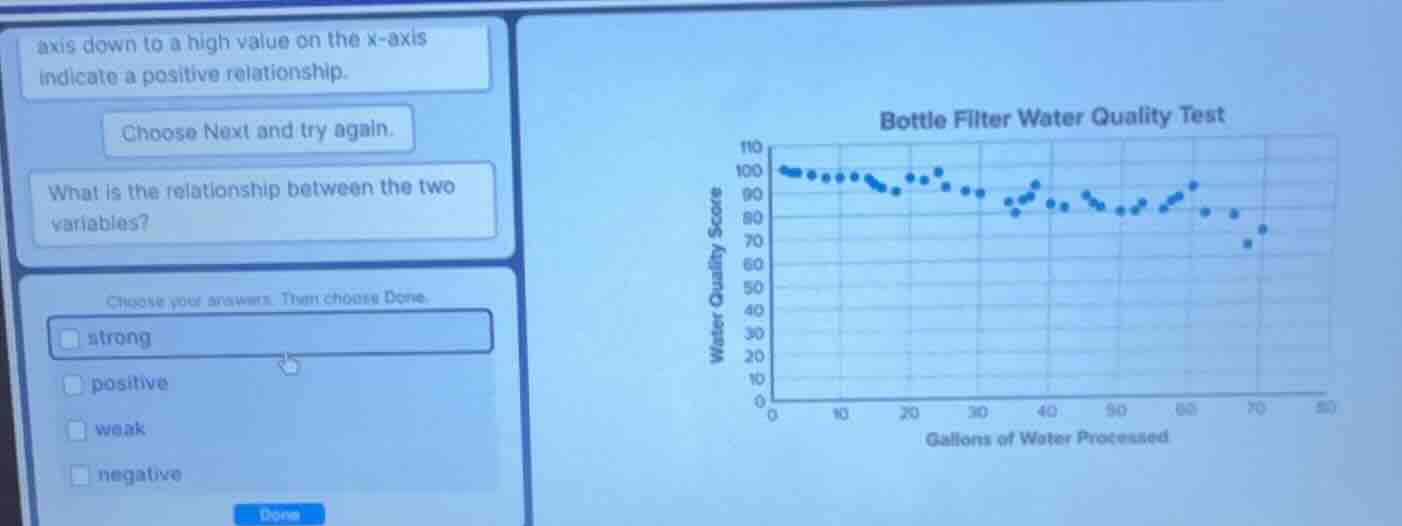
axis down to a high value on the x - axis indicate a positive relationship. choose next and try again. what is the relationship between the two variables? choose your answers. then choose done. strong positive weak negative done bottle filter water quality test water quality score 0 10 20 30 40 50 60 70 80 0 10 20 30 40 50 60 70 80 gallons of water processed
To determine the relationship, we analyze the scatter plot. The water quality score generally decreases as gallons processed increase (negative trend) and the points are somewhat spread but show a noticeable trend (not extremely strong, but weak? Wait, no—wait, the trend: as x (gallons) increases, y (quality score) tends to decrease? Wait, no, looking at the plot: initially around 100, then fluctuates but overall, as gallons go from 0 to 70, the quality score has a general downward trend? Wait, no, maybe I misread. Wait, the x - axis is gallons processed (0 to 80), y - axis is water quality score (0 to 110). The points start around 100, then have a general downward trend with fluctuations. So the relationship is negative (since as x increases, y tends to decrease) and weak? Wait, no—wait, the options are strong, positive, weak, negative. Let's think: a positive relationship is when x and y increase together, negative when one increases and the other decreases. The scatter plot shows that as gallons processed (x) increases, water quality score (y) generally decreases, so it's a negative relationship. Also, the points are not tightly clustered, but there is a noticeable trend, so it's a weak negative? Wait, no—maybe the key is the direction. Let's check the trend: from left to right (increasing x), the y - values (quality score) have a general downward trend. So the relationship is negative. Also, the strength: since the points are somewhat spread but show a trend, it's weak? Wait, but maybe the answer is negative and weak? Wait, the question is "What is the relationship between the two variables?" and we have to choose from the checkboxes. Wait, the options are strong, positive, weak, negative. Let's re - evaluate:
- Direction: As gallons processed (x) increases, water quality score (y) tends to decrease. So the relationship is negative (eliminates positive).
- Strength: The points are not tightly clustered around a line, so it's a weak relationship? Wait, no—maybe the trend is more noticeable. Wait, looking at the plot, from 0 to 70 gallons, the quality score starts at ~100 and ends at ~70, with fluctuations. So there is a negative trend, and the strength: it's not a strong linear relationship (points are spread), so it's weak? Wait, but maybe the intended answer is negative (for direction) and weak (for strength). But the question is about the relationship—so the relationship is negative (because of the downward trend) and weak (because the points are not tightly clustered). But let's check the options. The user has to choose from strong, positive, weak, negative. So the correct choices would be negative (for direction) and weak (for strength)? Wait, no—maybe the main direction is negative. Let's confirm:
- Positive: x and y increase together → no, since y decreases as x increases.
- Negative: x increases, y decreases → yes.
- Strength: since the points are not tightly grouped, it's weak. But maybe the question is asking for the type (direction) and strength. But the options are checkboxes, so we have to choose the appropriate ones. But maybe the key is that the relationship is negative (direction) and weak (strength). But let's see the plot again. The general trend is downward, so negative. And the points are not tightly clustered, so weak. But maybe the answer is negative (as the primary relationship direction) and weak? Wait, but the question is "What is the relationship between the two variables?" So the relationship is negative (because of the downward trend) and weak (because of the spread of points). But let's check th…

Snap & solve any problem in the app
Get step-by-step solutions on Sovi AI
Photo-based solutions with guided steps
Explore more problems and detailed explanations
The relationship between the two variables (gallons of water processed and water quality score) is negative (because as the number of gallons processed increases, the water quality score generally decreases) and weak (because the data points are not tightly clustered around a straight - line trend). So we would check the boxes for "negative" and "weak". But if we have to choose the most appropriate description of the relationship, the key aspects are the direction (negative) and the strength (weak). However, if we consider the options, the relationship is negative (due to the downward trend) and weak (due to the spread of the data points).