QUESTION IMAGE
Question
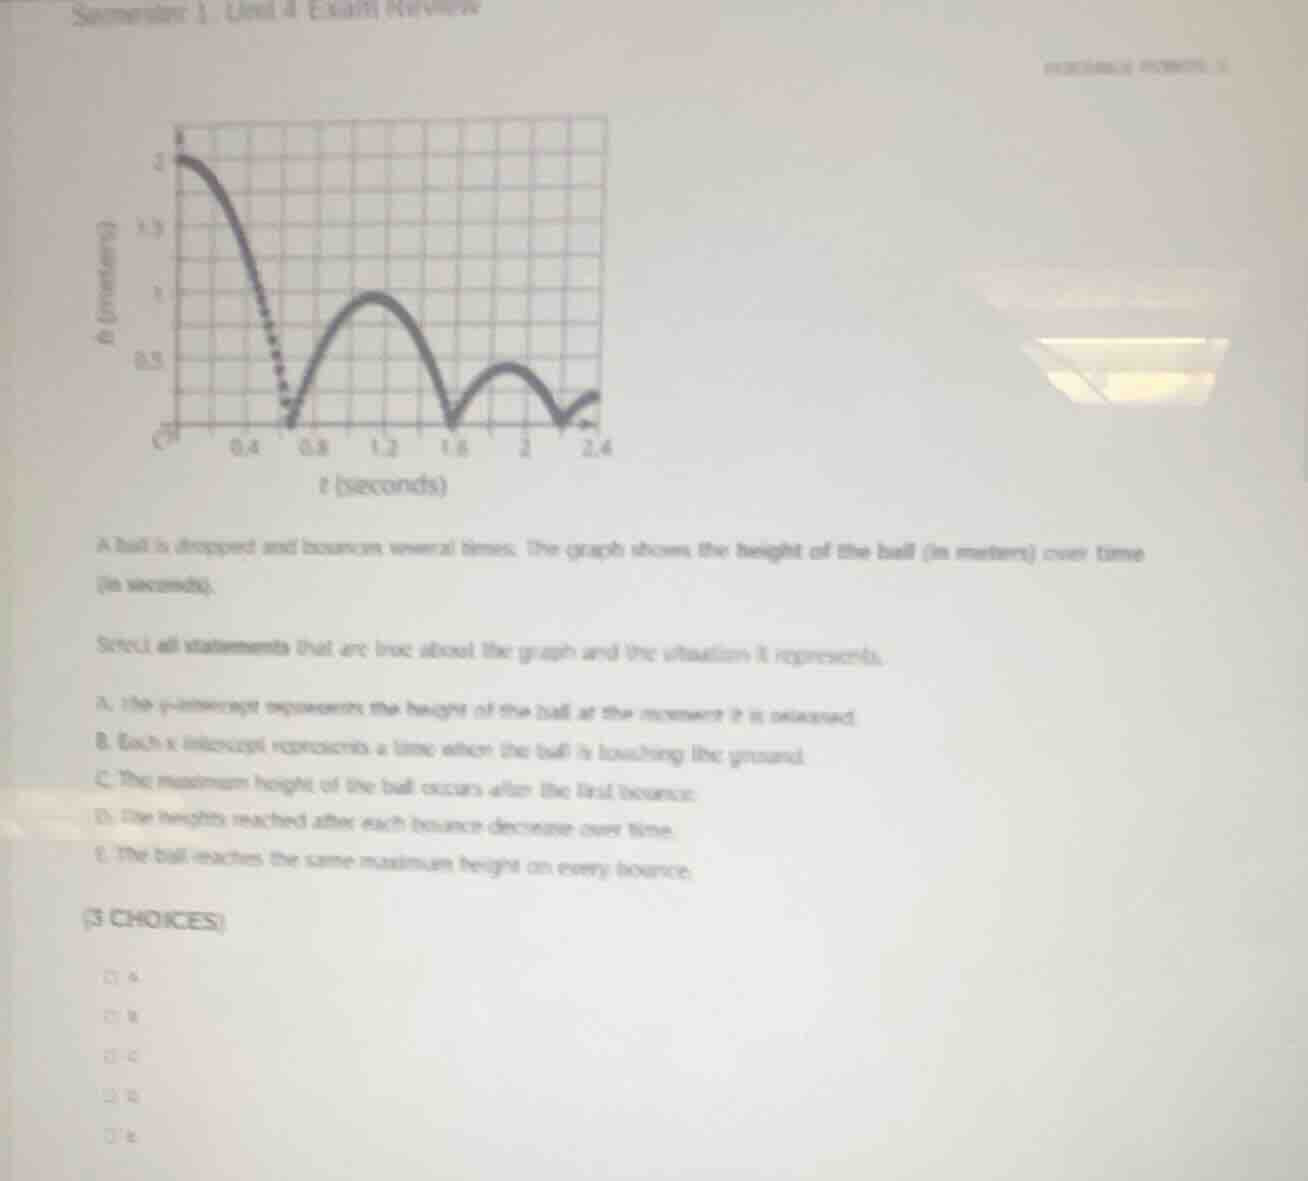
a ball is dropped and bounces several times. the graph shows the height of the ball (in meters) over time (in seconds).
select all statements that are true about the graph and the situation it represents.
a. the y - intercept represents the height of the ball at the moment it is released.
b. each x - intercept represents a time when the ball is touching the ground.
c. the maximum height of the ball occurs after the first bounce.
d. the heights reached after each bounce decrease over time.
e. the ball reaches the same maximum height on every bounce.
- Option A: The y-intercept is at \(t=0\) (time of release), matching the initial height of the ball.
- Option B: x-intercepts occur where \(h=0\), meaning the ball touches the ground at these times.
- Option C: The maximum height is at the y-intercept (before the first bounce), not after.
- Option D: Each peak (bounce height) is lower than the previous one, so heights decrease over time.
- Option E: The peaks get smaller with each bounce, so maximum heights are not equal.

Snap & solve any problem in the app
Get step-by-step solutions on Sovi AI
Photo-based solutions with guided steps
Explore more problems and detailed explanations
A. The y-intercept represents the height of the ball at the moment it is released.
B. Each x-intercept represents a time when the ball is touching the ground.
D. The heights reached after each bounce decrease over time.