QUESTION IMAGE
Question
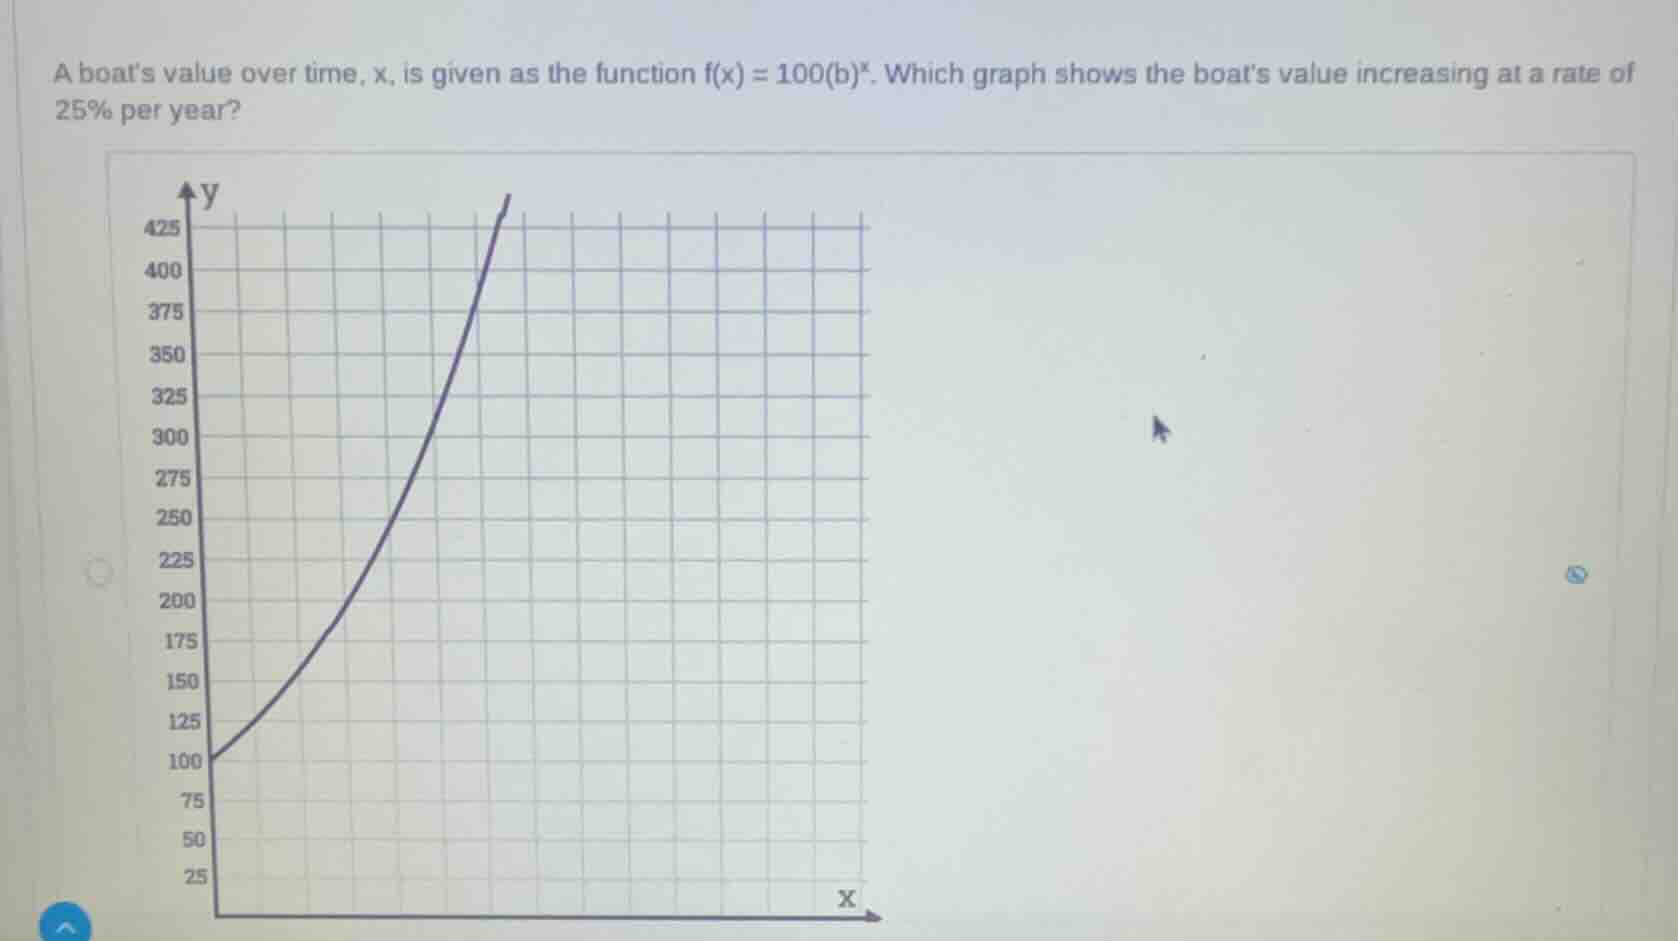
a boats value over time, x, is given as the function f(x) = 100(b)^x. which graph shows the boats value increasing at a rate of 25% per year?
Step1: Identify growth factor formula
For exponential growth, $b = 1 + r$, where $r$ is growth rate.
Step2: Calculate growth factor $b$
$r = 0.25$, so $b = 1 + 0.25 = 1.25$. The function is $f(x)=100(1.25)^x$.
Step3: Verify initial value
At $x=0$, $f(0)=100(1.25)^0 = 100$, matches the graph's y-intercept.
Step4: Check 1-year value
At $x=1$, $f(1)=100(1.25) = 125$, matches the graph.
Step5: Check 2-year value
At $x=2$, $f(2)=100(1.25)^2 = 156.25$, aligns with the graph's trend.

Snap & solve any problem in the app
Get step-by-step solutions on Sovi AI
Photo-based solutions with guided steps
Explore more problems and detailed explanations
The provided graph is the correct one that represents the boat's value increasing at 25% per year.