QUESTION IMAGE
Question
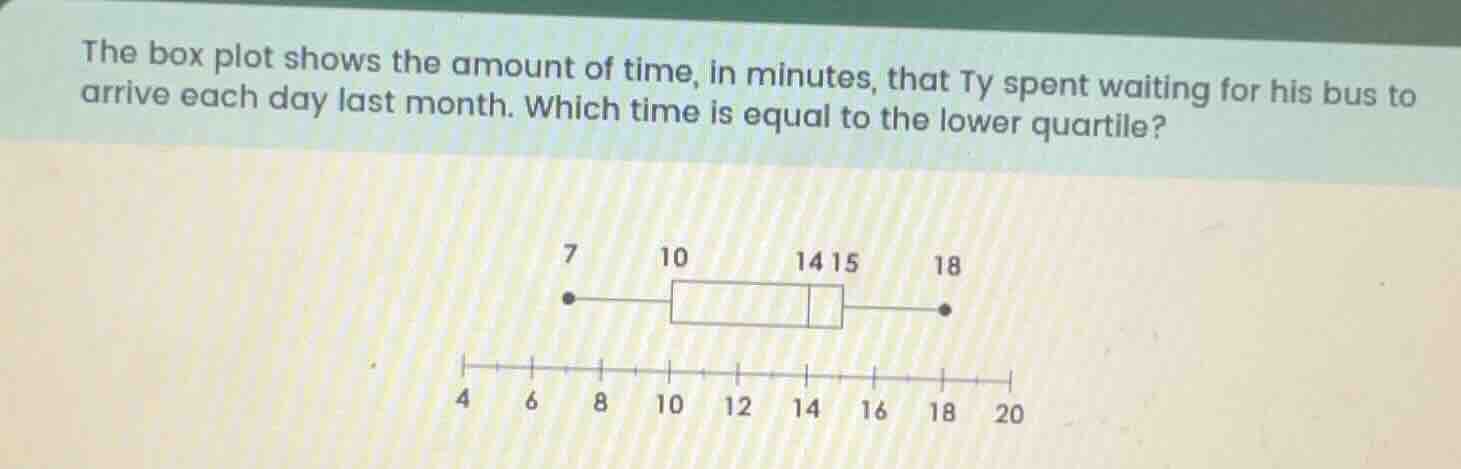
the box plot shows the amount of time, in minutes, that ty spent waiting for his bus to arrive each day last month. which time is equal to the lower quartile?
Step1: Recall box plot quartile positions
In a box plot, the left edge of the rectangular box represents the lower quartile (Q1).
Step2: Identify Q1 from the plot
The left edge of the box aligns with the value 10 on the number line.

Snap & solve any problem in the app
Get step-by-step solutions on Sovi AI
Photo-based solutions with guided steps
Explore more problems and detailed explanations
10 minutes