QUESTION IMAGE
Question
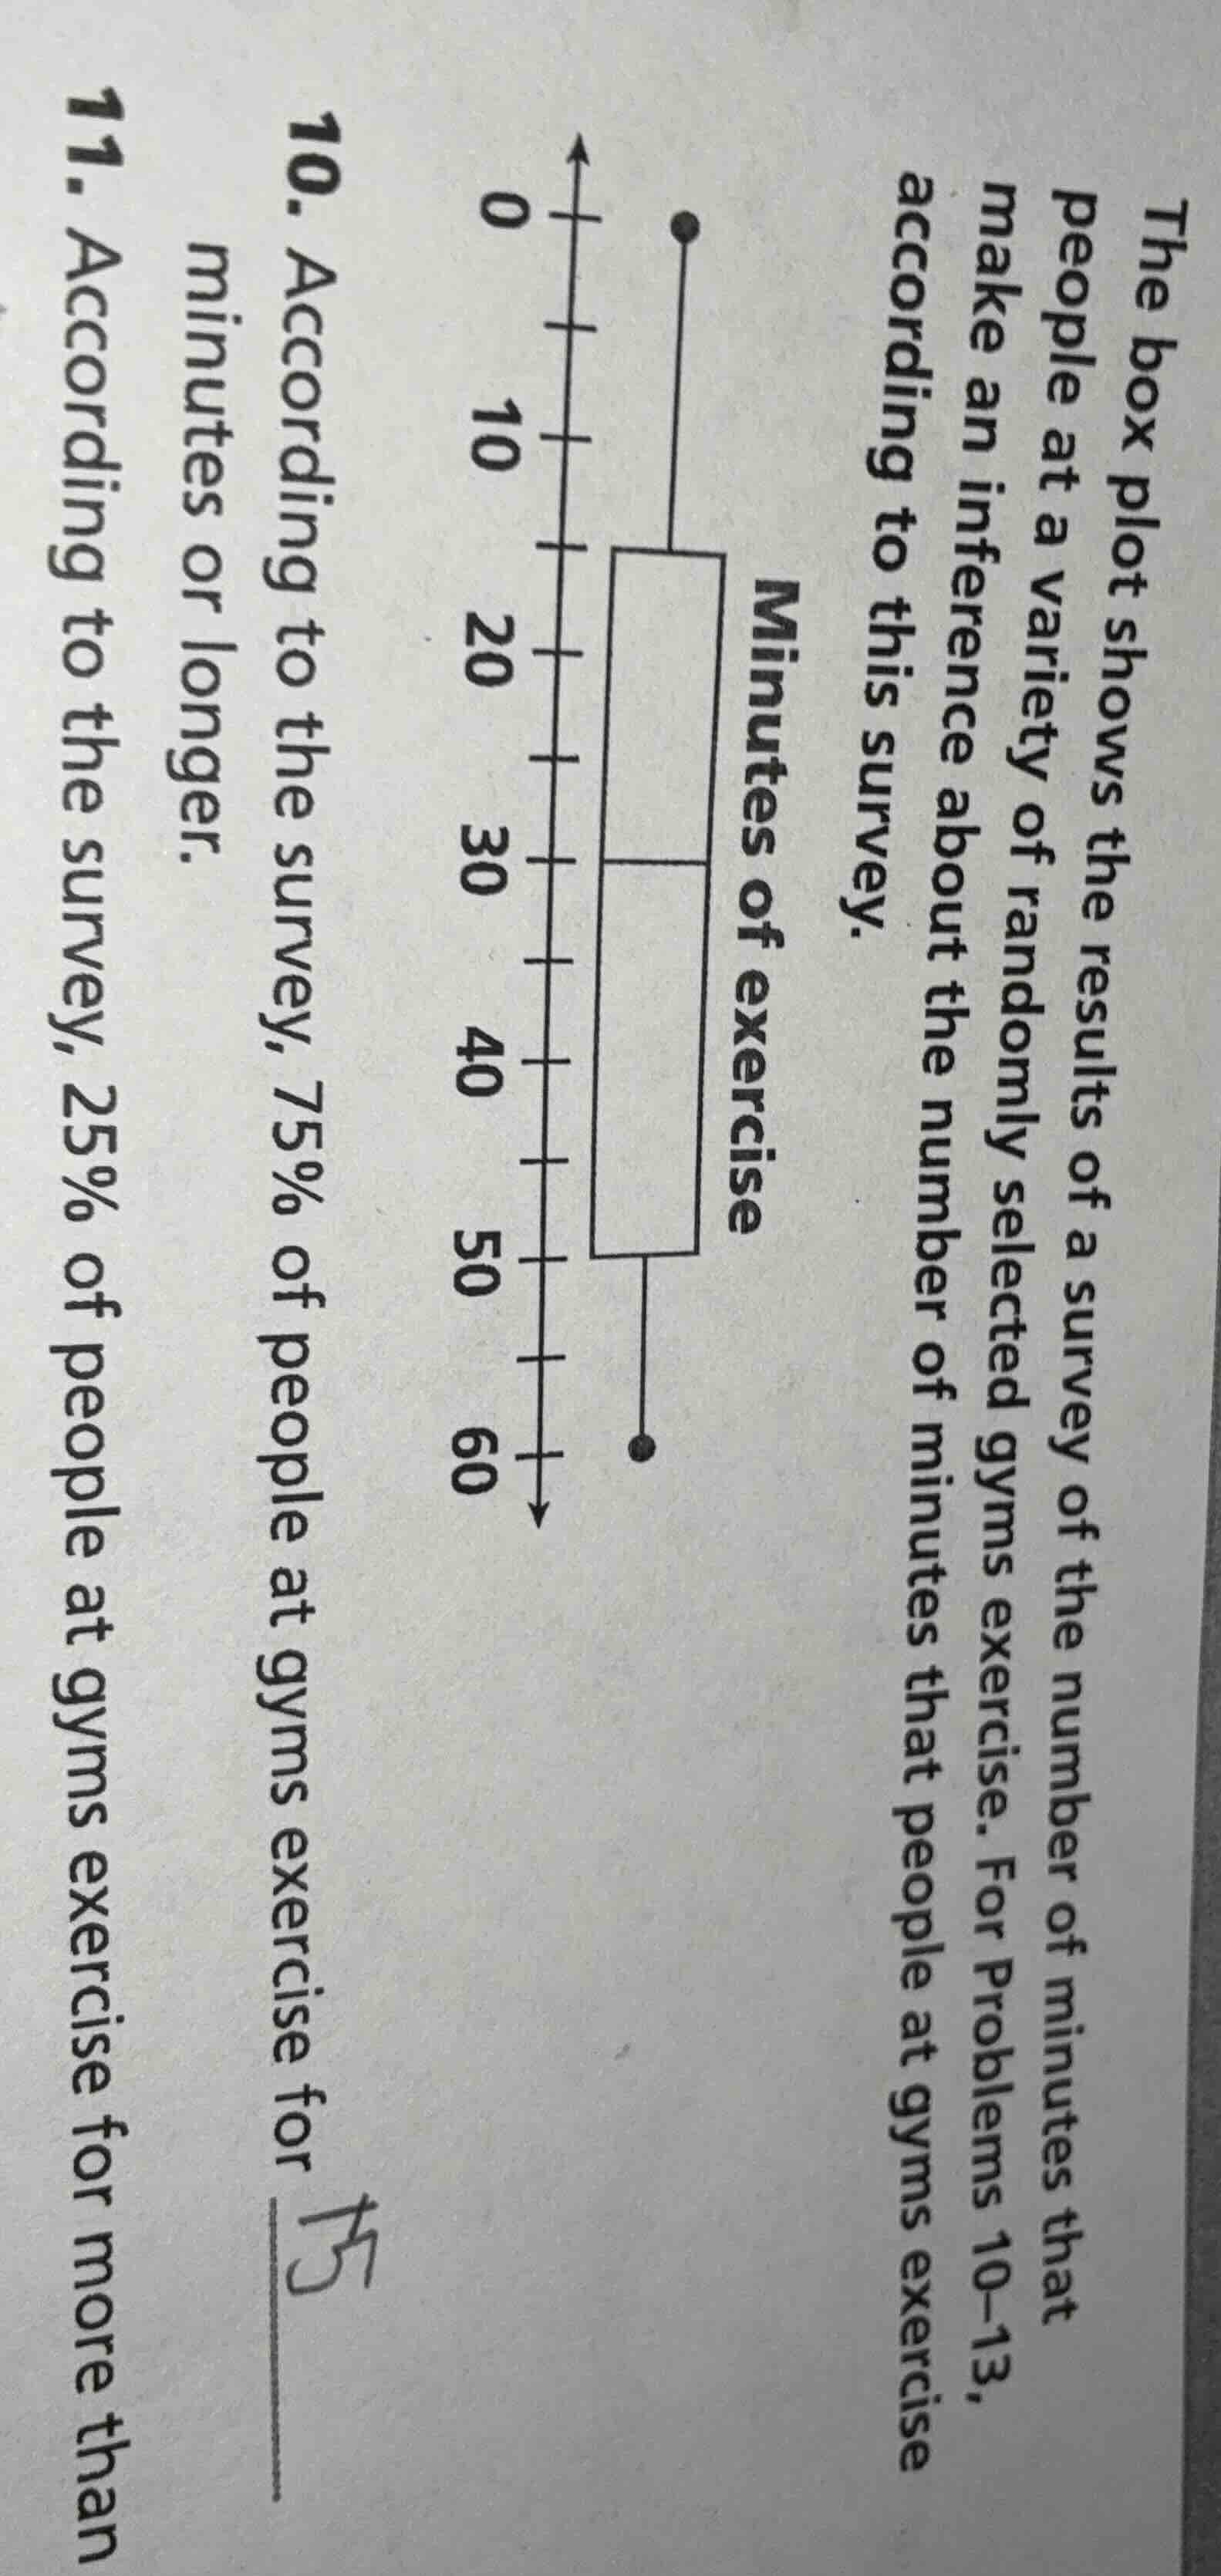
the box plot shows the results of a survey of the number of minutes that people at a variety of randomly selected gyms exercise. for problems 10–13, make an inference about the number of minutes that people at gyms exercise according to this survey.
- according to the survey, 75% of people at gyms exercise for ______ minutes or longer.
- according to the survey, 25% of people at gyms exercise for more than
Step1: Identify Q1 from box plot
The first quartile (Q1) of the box plot is at 15 minutes.
Step2: Interpret Q1 for 75% threshold
In a box plot, 75% of data lies at or above Q1, so 75% exercise for 15 minutes or longer.

Snap & solve any problem in the app
Get step-by-step solutions on Sovi AI
Photo-based solutions with guided steps
Explore more problems and detailed explanations
- 15 minutes
- (Note: Problem 11 is incomplete, only the first part is answerable)