QUESTION IMAGE
Question
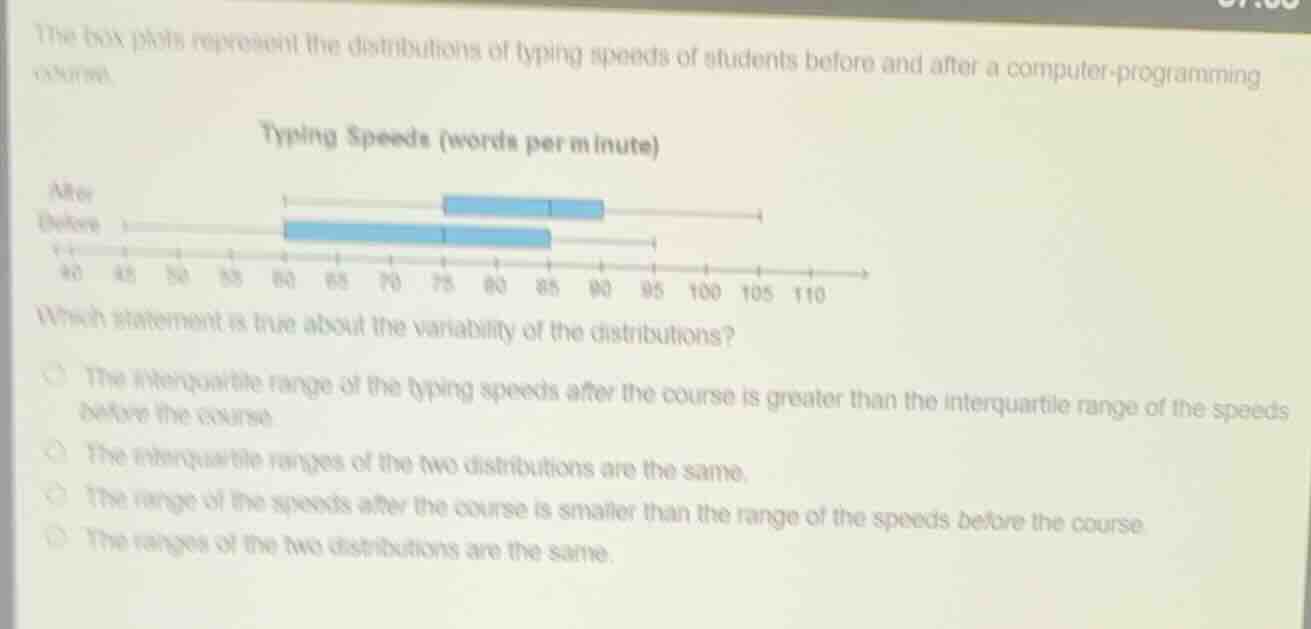
the box plots represent the distributions of typing speeds of students before and after a computer - programming course.
typing speeds (words per minute)
after
before
40 45 50 55 60 65 70 75 80 85 90 95 100 105 110
which statement is true about the variability of the distributions?
the interquartile range of the typing speeds after the course is greater than the interquartile range of the speeds before the course.
the interquartile ranges of the two distributions are the same.
the range of the speeds after the course is smaller than the range of the speeds before the course.
the ranges of the two distributions are the same.
Step1: Recall Range and IQR
Range = Max - Min. IQR = Q3 - Q1 (box length in box - plot).
Step2: Analyze Range
- Before: Min ≈ 40, Max ≈ 95. Range = 95 - 40 = 55.
- After: Min ≈ 60, Max ≈ 110? Wait, no, looking at the plot: Before's whiskers: left at ~40, right at ~95. After's left at ~60, right at ~110? Wait, no, the x - axis: 40,45,50,55,60,65,70,75,80,85,90,95,100,105,110.
Wait, re - examine:
Before: Min (left whisker) ~40, Max (right whisker) ~95. So Range_before = 95 - 40 = 55.
After: Min (left whisker) ~60, Max (right whisker) ~110? Wait, no, the box - plot for After: left whisker at 60? Wait, no, the "After" whisker left is at 60? Wait, the plot: "After" has left whisker at 60? Wait, the x - axis labels: 40,45,50,55,60,65,70,75,80,85,90,95,100,105,110.
Wait, "Before" whiskers: left at 40, right at 95. "After" whiskers: left at 60, right at 110? No, wait the "After" box: the left whisker is at 60? Wait, no, the "After" line (whisker) left is at 60? Wait, the "Before" box: from 60 to 85? Wait, no, the blue boxes: "Before" box is from 60 to 85 (Q1 = 60, Q3 = 85), "After" box is from 75 to 90 (Q1 = 75, Q3 = 90).
Wait, Range:
Before: Max - Min = 95 - 40 = 55.
After: Max - Min = 110 - 60 = 50? Wait, no, maybe I misread. Wait the "After" right whisker: looking at the plot, the "After" right whisker is at 110? No, the x - axis goes to 110. Wait, "Before" right whisker is at 95, "After" right whisker at 110? No, maybe the "After" max is 110, "Before" max is 95. "Before" min is 40, "After" min is 60. So Range_before = 95 - 40 = 55, Range_after = 110 - 60 = 50? Wait, no, maybe the "After" max is 110? Wait, the x - axis labels: 40,45,50,55,60,65,70,75,80,85,90,95,100,105,110. So "After" min is 60, max is 110? "Before" min is 40, max is 95. So Range_after = 110 - 60 = 50, Range_before = 95 - 40 = 55. So Range_after < Range_before.
Now IQR:
IQR = Q3 - Q1.
Before: Q1 = 60, Q3 = 85. IQR_before = 85 - 60 = 25.
After: Q1 = 75, Q3 = 90. IQR_after = 90 - 75 = 15. So IQR_after < IQR_before.
Now check options:
- "The interquartile range of the typing speeds after the course is greater than the interquartile range of the speeds before the course" → False (15 < 25).
- "The interquartile ranges of the two distributions are the same" → False (15 ≠ 25).
- "The range of the speeds after the course is smaller than the range of the speeds before the course" → Range_after = 110 - 60 = 50, Range_before = 95 - 40 = 55. 50 < 55. True.
- "The ranges of the two distributions are the same" → 50 ≠ 55. False.

Snap & solve any problem in the app
Get step-by-step solutions on Sovi AI
Photo-based solutions with guided steps
Explore more problems and detailed explanations
The range of the speeds after the course is smaller than the range of the speeds before the course (the option with this statement)