QUESTION IMAGE
Question
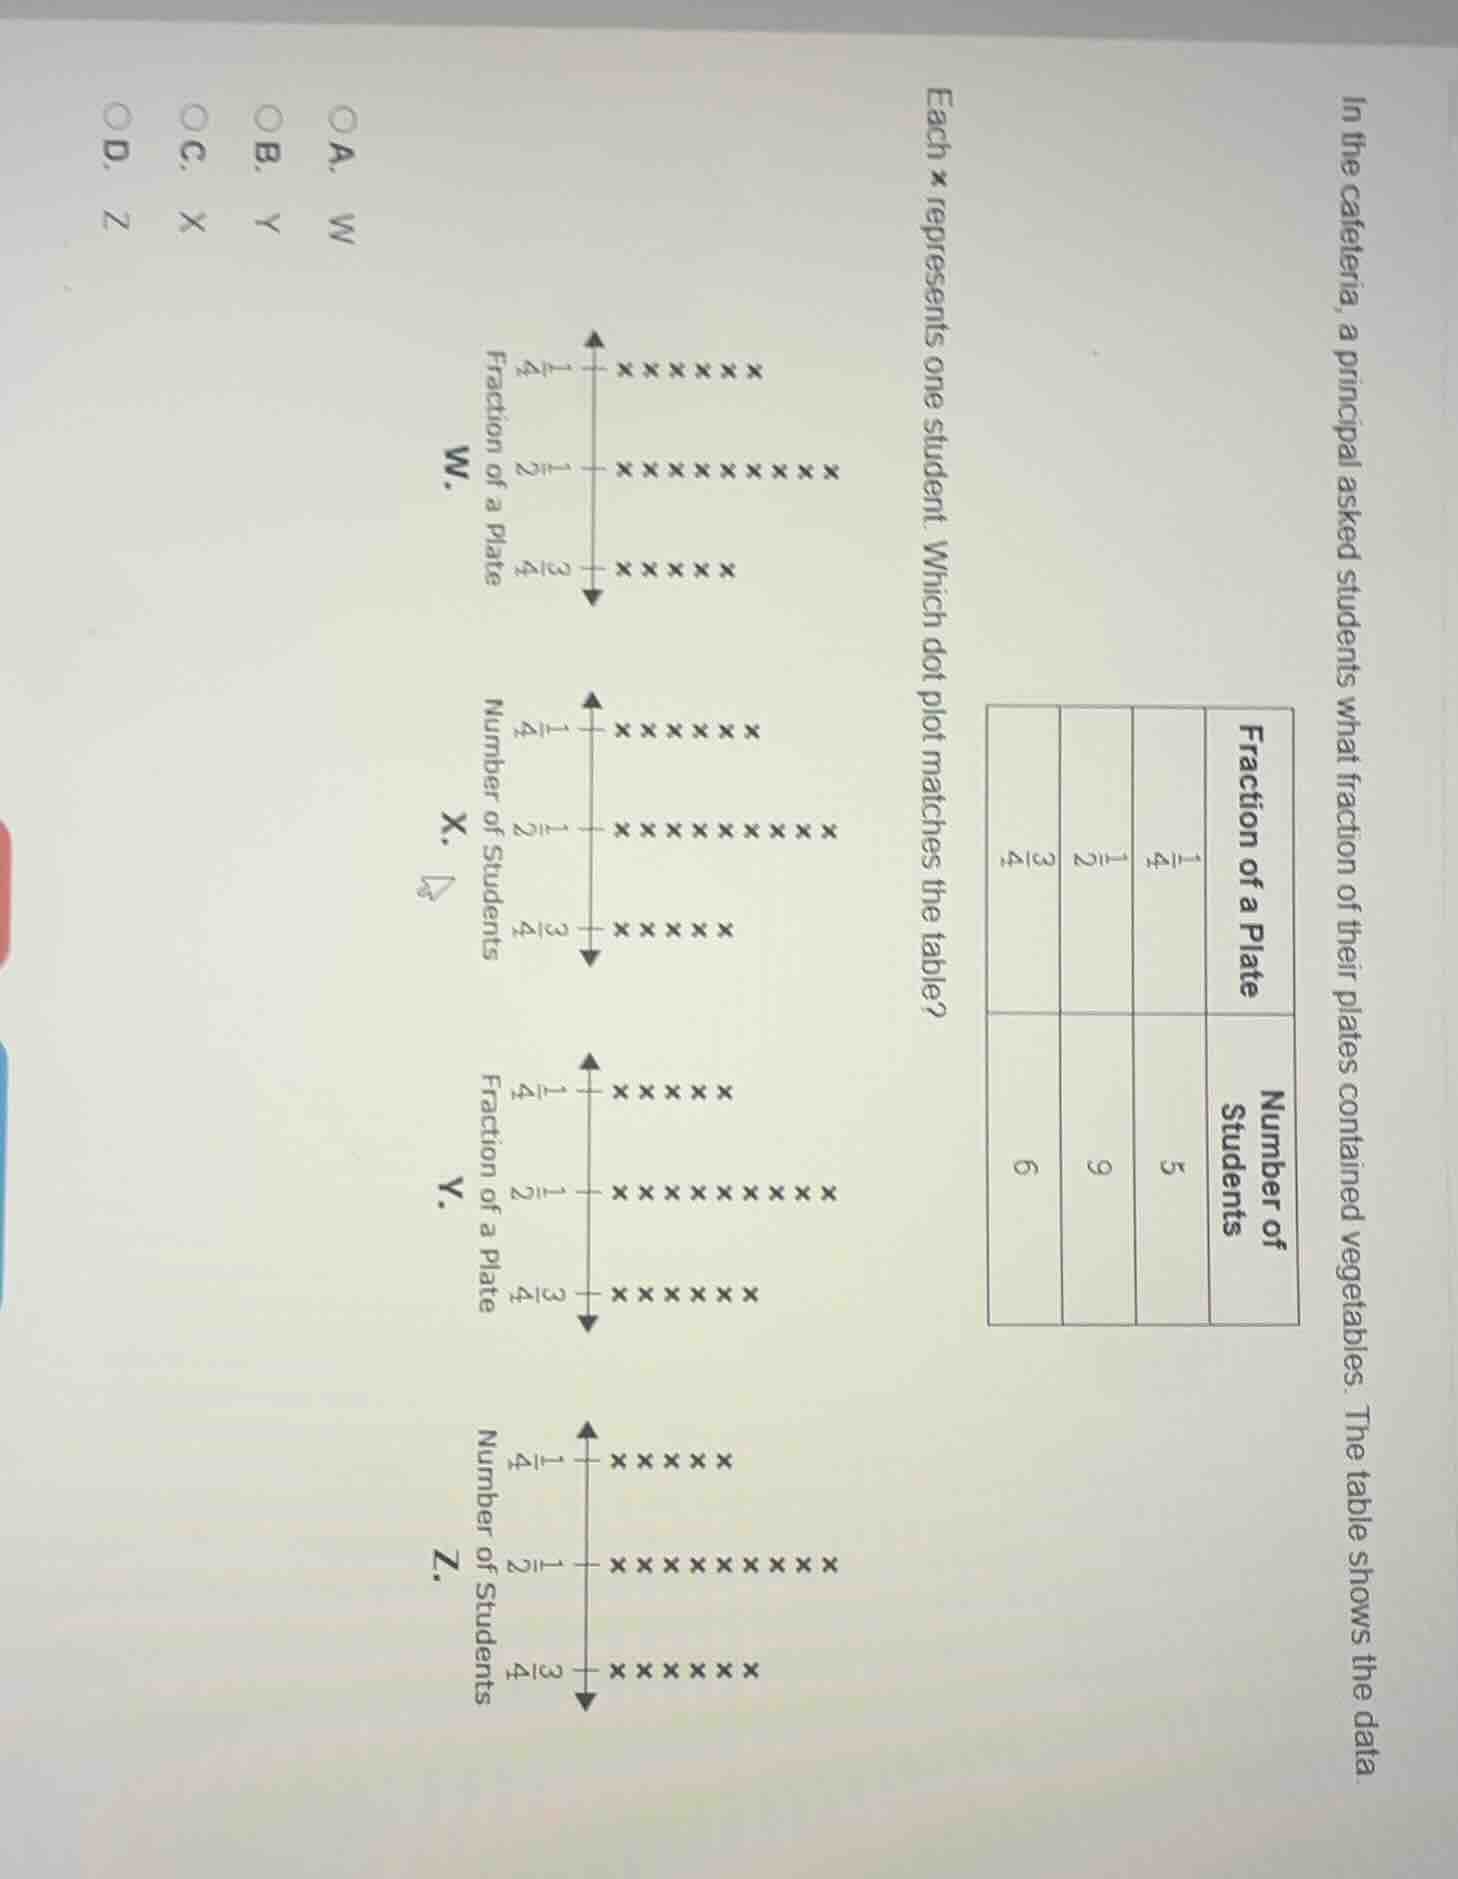
in the cafeteria, a principal asked students what fraction of their plates contained vegetables. the table shows the data
| fraction of a plate | number of students | ---- | ---- | $\frac{1}{4}$ | 5 | $\frac{1}{2}$ | 9 | $\frac{3}{4}$ | 6 | each × represents one student. which dot plot matches the table?w.fraction of a plate$\frac{1}{4}$: ×××××$\frac{1}{2}$: ×××××××××$\frac{3}{4}$: ××××××x.number of students$\frac{1}{4}$: ×××××$\frac{1}{2}$: ×××××××××$\frac{3}{4}$: ××××××y.fraction of a plate$\frac{1}{4}$: ×××××$\frac{1}{2}$: ×××××××××$\frac{3}{4}$: ××××××z.number of students$\frac{1}{4}$: ×××××$\frac{1}{2}$: ×××××××××$\frac{3}{4}$: ××××××○a. w○b. y○c. x○d. z |
Step1: Match table data to plot
Check each plot:
- $\frac{1}{4}$: 5 students → 5 ×'s
- $\frac{1}{2}$: 9 students → 9 ×'s
- $\frac{3}{4}$: 6 students → 6 ×'s
- Plot Y has 5 ×'s at $\frac{1}{4}$, 9 ×'s at $\frac{1}{2}$, 6 ×'s at $\frac{3}{4}$.

Snap & solve any problem in the app
Get step-by-step solutions on Sovi AI
Photo-based solutions with guided steps
Explore more problems and detailed explanations
B. Y