QUESTION IMAGE
Question
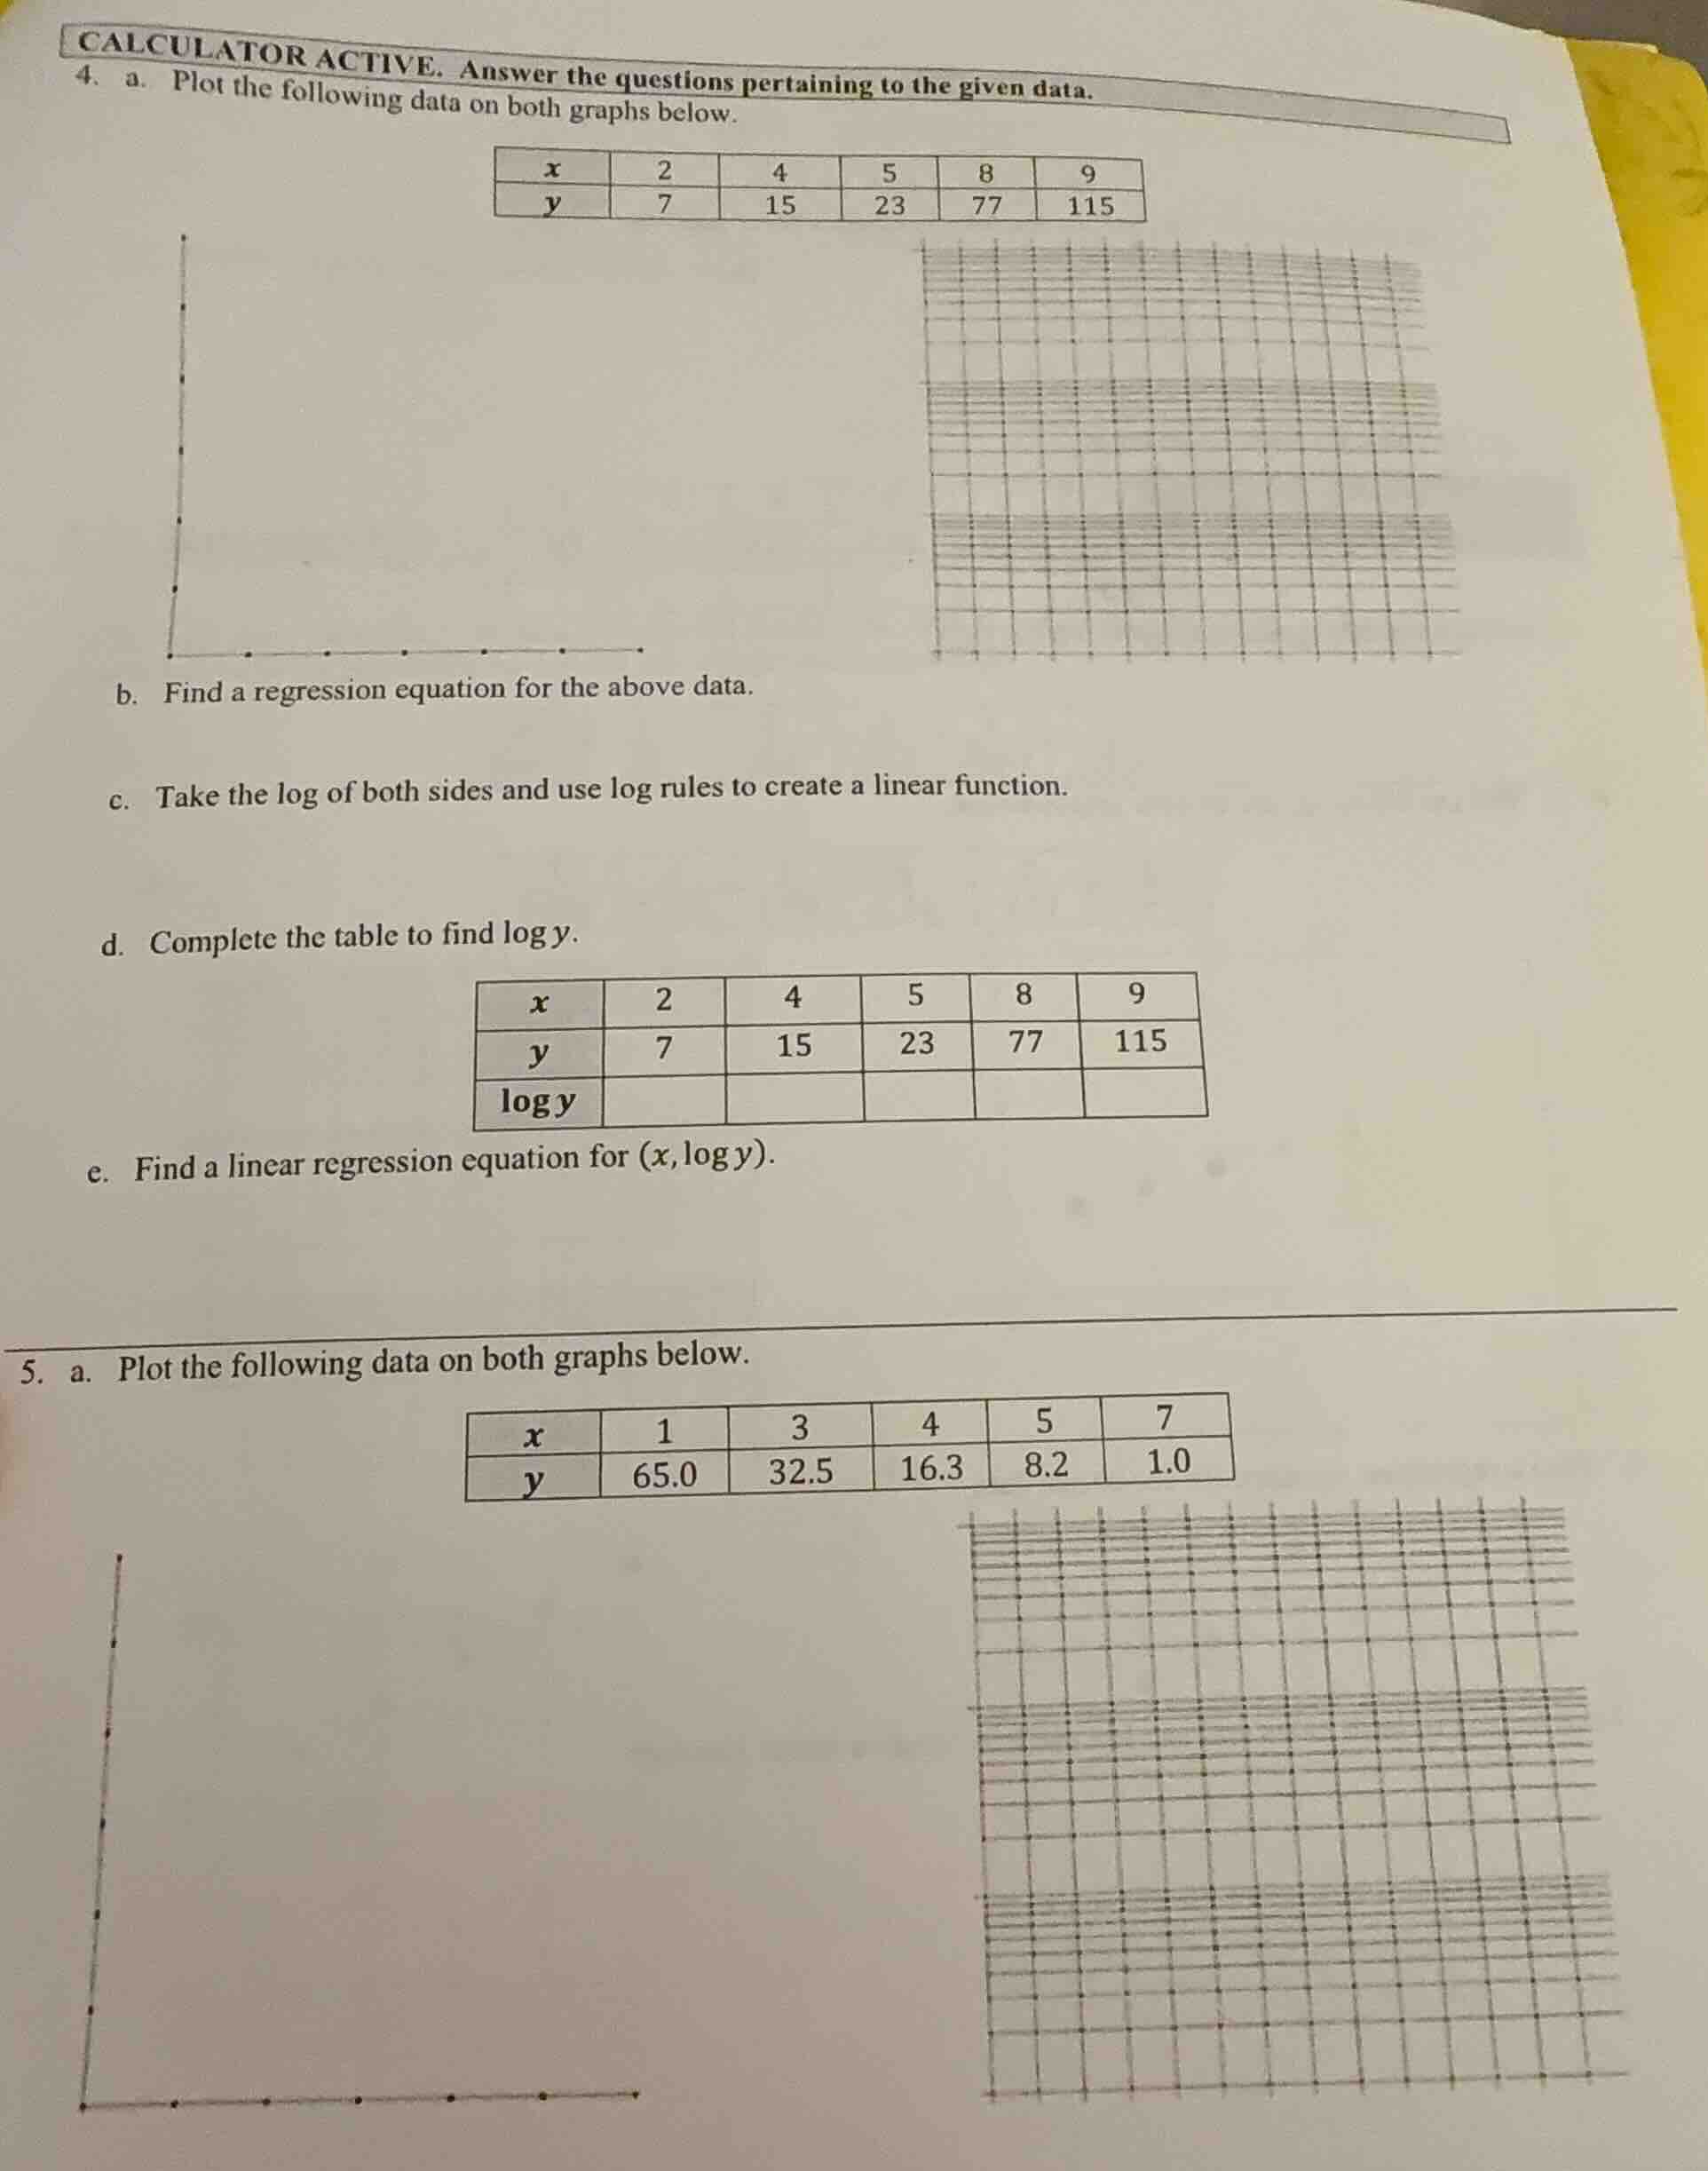
calculator active. answer the questions pertaining to the given data.
- a. plot the following data on both graphs below.
| x | 2 | 4 | 5 | 8 | 9 |
| y | 7 | 15 | 23 | 77 | 115 |
graphs
b. find a regression equation for the above data.
c. take the log of both sides and use log rules to create a linear function.
d. complete the table to find log y.
| x | 2 | 4 | 5 | 8 | 9 |
| y | 7 | 15 | 23 | 77 | 115 |
| log y |
e. find a linear regression equation for (x, log y).
- a. plot the following data on both graphs below.
| x | 1 | 3 | 4 | 5 | 7 |
| y | 65.0 | 32.5 | 16.3 | 8.2 | 1.0 |
graphs
Part 4d: Complete the table to find \(\boldsymbol{\log y}\) (assuming base 10 logarithm)
Step 1: Calculate \(\log(7)\)
Using a calculator, \(\log(7) \approx 0.8451\)
Step 2: Calculate \(\log(15)\)
Using a calculator, \(\log(15) \approx 1.1761\)
Step 3: Calculate \(\log(23)\)
Using a calculator, \(\log(23) \approx 1.3617\)
Step 4: Calculate \(\log(77)\)
Using a calculator, \(\log(77) \approx 1.8865\)
Step 5: Calculate \(\log(115)\)
Using a calculator, \(\log(115) \approx 2.0607\)
Step 1: List the data points \((x, \log y)\)
From part 4d, the points are \((2, 0.8451)\), \((4, 1.1761)\), \((5, 1.3617)\), \((8, 1.8865)\), \((9, 2.0607)\)
Step 2: Calculate the mean of \(x\) (\(\bar{x}\)) and mean of \(\log y\) (\(\bar{\log y}\))
\[
\bar{x}=\frac{2 + 4+5 + 8+9}{5}=\frac{28}{5} = 5.6
\]
\[
\bar{\log y}=\frac{0.8451+1.1761 + 1.3617+1.8865+2.0607}{5}=\frac{7.3301}{5}=1.46602
\]
Step 3: Calculate the slope \(m\) of the linear regression line
The formula for slope \(m\) is:
\[
m=\frac{\sum_{i = 1}^{n}(x_i-\bar{x})(\log y_i-\bar{\log y})}{\sum_{i = 1}^{n}(x_i-\bar{x})^2}
\]
First, calculate \((x_i-\bar{x})\) and \((\log y_i-\bar{\log y})\) for each point:
- For \((2, 0.8451)\): \(x - \bar{x}=2 - 5.6=- 3.6\), \(\log y-\bar{\log y}=0.8451 - 1.46602=-0.62092\), product \(=(-3.6)\times(-0.62092) = 2.235312\), \((x - \bar{x})^2=(-3.6)^2 = 12.96\)
- For \((4, 1.1761)\): \(x - \bar{x}=4 - 5.6=-1.6\), \(\log y-\bar{\log y}=1.1761 - 1.46602=-0.28992\), product \(=(-1.6)\times(-0.28992)=0.463872\), \((x - \bar{x})^2=(-1.6)^2 = 2.56\)
- For \((5, 1.3617)\): \(x - \bar{x}=5 - 5.6=-0.6\), \(\log y-\bar{\log y}=1.3617 - 1.46602=-0.10432\), product \(=(-0.6)\times(-0.10432) = 0.062592\), \((x - \bar{x})^2=(-0.6)^2 = 0.36\)
- For \((8, 1.8865)\): \(x - \bar{x}=8 - 5.6 = 2.4\), \(\log y-\bar{\log y}=1.8865 - 1.46602 = 0.42048\), product \(=2.4\times0.42048 = 1.009152\), \((x - \bar{x})^2=(2.4)^2 = 5.76\)
- For \((9, 2.0607)\): \(x - \bar{x}=9 - 5.6 = 3.4\), \(\log y-\bar{\log y}=2.0607 - 1.46602 = 0.59468\), product \(=3.4\times0.59468 = 2.021912\), \((x - \bar{x})^2=(3.4)^2 = 11.56\)
Now, sum the products: \(2.235312+0.463872 + 0.062592+1.009152+2.021912=5.79284\)
Sum the \((x - \bar{x})^2\) values: \(12.96+2.56 + 0.36+5.76+11.56 = 33.2\)
Then, \(m=\frac{5.79284}{33.2}\approx0.1745\)
Step 4: Calculate the y-intercept \(b\)
Using the formula \(b=\bar{\log y}-m\bar{x}\)
\[
b = 1.46602-0.1745\times5.6
\]
\[
b=1.46602 - 0.9772
\]
\[
b\approx0.4888
\]
Step 5: Write the linear regression equation
The linear regression equation is \(\log y=mx + b\), so \(\log y=0.1745x + 0.4888\) (values are approximate)
Step 1: Identify the data points
The data points are \((1, 65.0)\), \((3, 32.5)\), \((4, 16.3)\), \((5, 8.2)\), \((7, 1.0)\)
Step 2: Plot on a coordinate system
For the first graph (assuming a regular Cartesian plane) and the second graph (with grid lines), mark the points with \(x\) as the horizontal axis and \(y\) as the vertical axis. For example, for \((1, 65.0)\), move 1 unit on the \(x\)-axis and 65 units on the \(y\)-axis (adjusting the scale if needed), and similarly for other points.

Snap & solve any problem in the app
Get step-by-step solutions on Sovi AI
Photo-based solutions with guided steps
Explore more problems and detailed explanations
| \(x\) | \(2\) | \(4\) | \(5\) | \(8\) | \(9\) |
|---|---|---|---|---|---|
| \(\log y\) | \(0.8451\) | \(1.1761\) | \(1.3617\) | \(1.8865\) | \(2.0607\) |