QUESTION IMAGE
Question
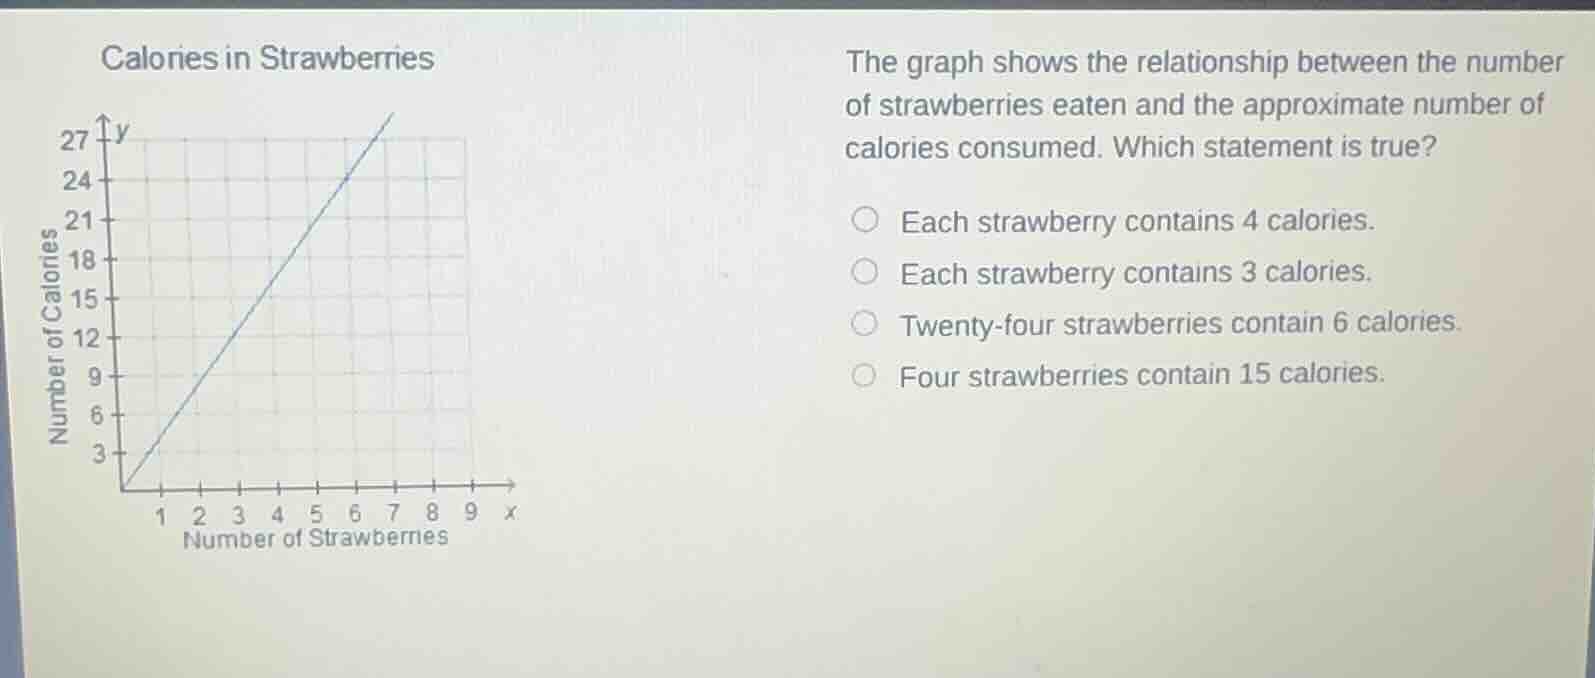
calories in strawberries
the graph shows the relationship between the number of strawberries eaten and the approximate number of calories consumed. which statement is true?
each strawberry contains 4 calories.
each strawberry contains 3 calories.
twenty - four strawberries contain 6 calories.
four strawberries contain 15 calories.
Step1: Analyze the graph's slope
The slope of the line (calories per strawberry) is calculated as $\frac{\Delta y}{\Delta x}$. From the graph, when $x = 3$ (strawberries), $y = 12$ (calories). So slope $=\frac{12 - 0}{3 - 0}= 4$? Wait, no, wait. Wait, when $x = 2$, $y = 6$? Wait, no, let's check again. Wait, the y-axis is calories, x-axis is strawberries. Let's take two points: (0,0) and (3, 12)? Wait, no, when x=3, y=12? Wait, no, looking at the graph, when x=2, y=6? Wait, no, the grid: each x is 1, y is 3? Wait, no, the first point: when x=1, y=3? Wait, no, the line starts at (0,0), and when x=3, y=12? Wait, no, let's check the options. Let's test each option.
Option 1: Each strawberry has 4 calories. So for x strawberries, y=4x. Let's check x=3: y=12. Does the graph have (3,12)? Yes, because the line goes through (3,12) (since at x=3, y=12). Wait, but wait, when x=2, y=8? No, wait the graph: when x=2, y=6? Wait, no, maybe I misread. Wait the y-axis is 3,6,9,12,15,18,21,24,27. So each grid line is 3. So when x=1, y=3? No, the line is steeper. Wait, let's take two points: (0,0) and (3, 12)? Wait, no, when x=3, y=12? Wait, the line is from (0,0) to (6,24)? Wait, 24 calories for 6 strawberries: 24/6=4. So 4 calories per strawberry. So option 1: each strawberry has 4 calories. Let's check option 2: 3 calories per strawberry. Then 6 strawberries would have 18 calories, but the graph at x=6 has y=24, which is 24, so 24/6=4, not 3. So option 2 is wrong. Option 3: 24 strawberries contain 6 calories. 244=96, not 6. Wrong. Option 4: 4 strawberries contain 15 calories. 44=16, not 15. Wait, but maybe my initial analysis is wrong. Wait, let's re-examine the graph. The x-axis is number of strawberries (1,2,3,...), y-axis is calories (3,6,9,...). Wait, the line passes through (3,12), (6,24), etc. So slope is 12/3=4, 24/6=4. So each strawberry has 4 calories. So option 1 is correct.
Wait, but let's check again. If each strawberry has 4 calories, then for x strawberries, y=4x. So when x=3, y=12 (matches the graph, since at x=3, y=12). When x=6, y=24 (matches the graph, since at x=6, y=24). So option 1 is correct.
Step2: Test each option
- Option 1: Each strawberry has 4 calories. So y = 4x. For x=3, y=12 (matches graph). For x=6, y=24 (matches graph). Correct.
- Option 2: Each strawberry has 3 calories. Then y=3x. For x=6, y=18, but graph has y=24 at x=6. Wrong.
- Option 3: 24 strawberries have 6 calories. 24*4=96≠6. Wrong.
- Option 4: 4 strawberries have 15 calories. 4*4=16≠15. Wrong.
So the correct option is "Each strawberry contains 4 calories."

Snap & solve any problem in the app
Get step-by-step solutions on Sovi AI
Photo-based solutions with guided steps
Explore more problems and detailed explanations
Each strawberry contains 4 calories. (The option corresponding to this statement, e.g., if it's the first option, then "A. Each strawberry contains 4 calories" assuming the options are labeled A, B, C, D as: A. Each strawberry contains 4 calories, B. Each strawberry contains 3 calories, C. Twenty - four strawberries contain 6 calories, D. Four strawberries contain 15 calories. So the answer is A. Each strawberry contains 4 calories)