QUESTION IMAGE
Question
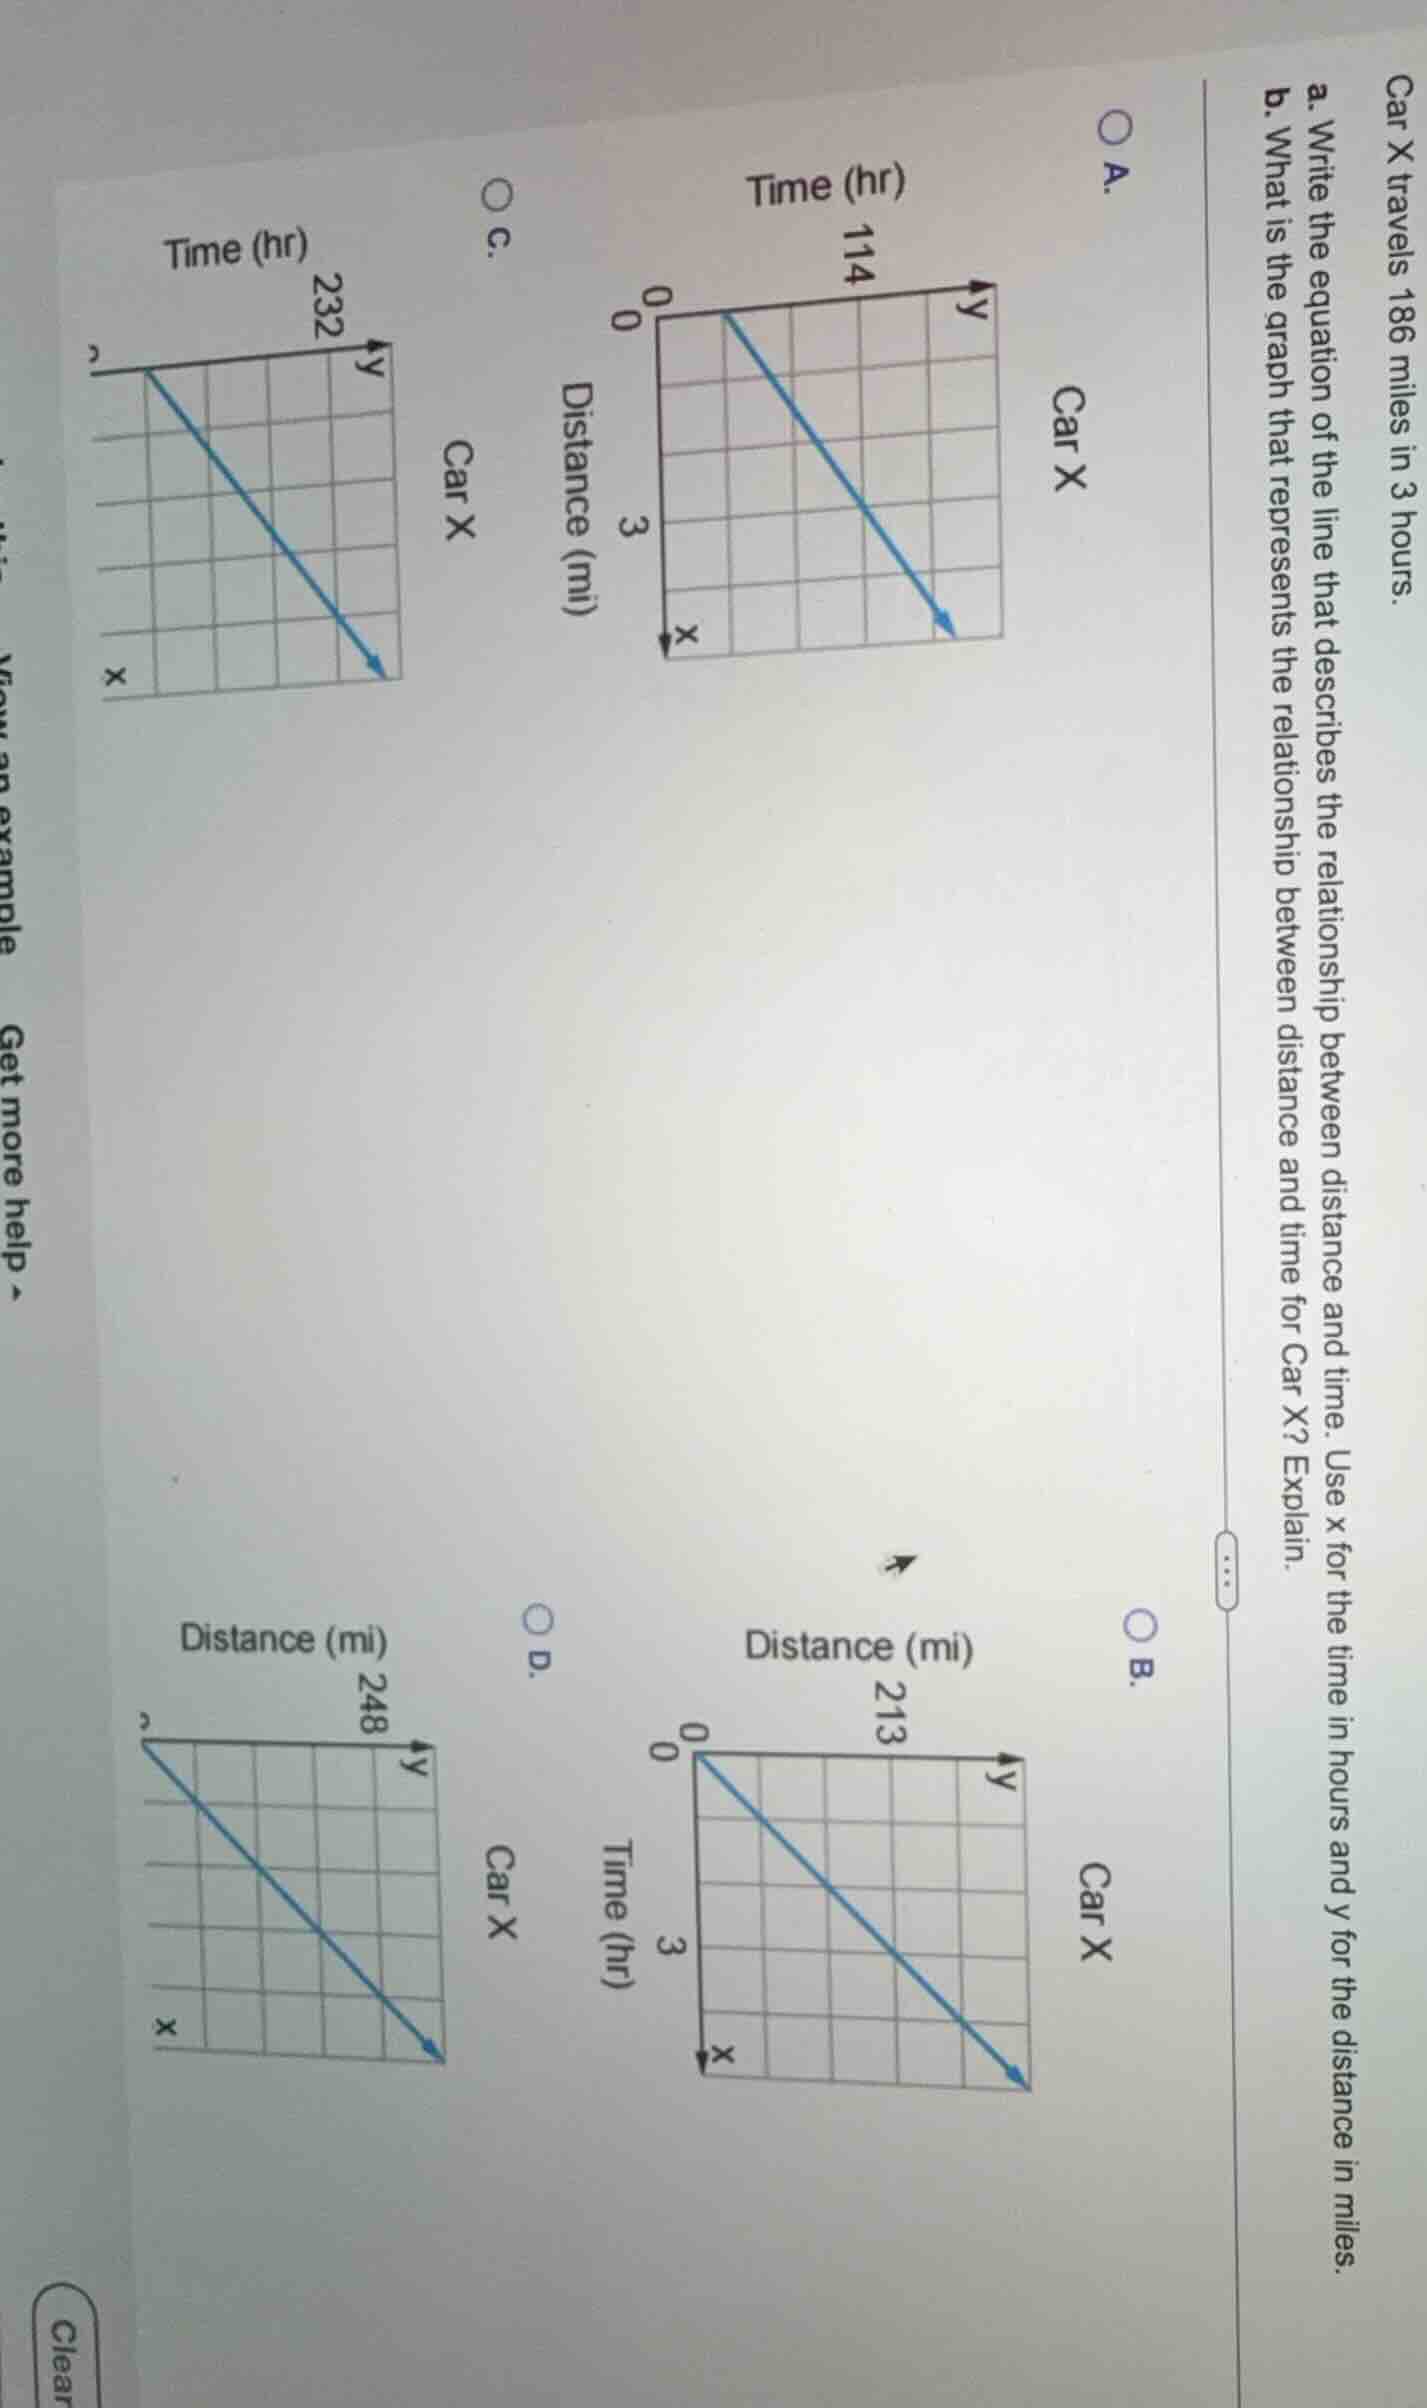
car x travels 186 miles in 3 hours.
a. write the equation of the line that describes the relationship between distance and time. use x for the time in hours and y for the distance in miles.
b. what is the graph that represents the relationship between distance and time for car x? explain.
a. car x
b. car x
c. car x
d. car x
Step1: Calculate speed (slope)
$\text{Speed} = \frac{186}{3} = 62$ miles/hour
Step2: Write linear equation
Since distance $y$ equals speed times time $x$, the equation is $y = 62x$.
Step3: Verify graph for x=3
When $x=3$, $y=62\times3=186$. Check which graph has $y=186$ at $x=3$:
- Option A: $y=114$ at $x=3$ (incorrect)
- Option B: $y=213$ at $x=3$ (incorrect)
- Option C: $y=232$ at $x=4$ (matches $62\times4=248$? No, $62\times3=186$, $62\times4=248$: Option D has $y=248$ at $x=4$, and $y=186$ at $x=3$, which fits.
Step4: Confirm graph validity
The correct graph has a slope of 62, passing through (0,0) and (3,186), which matches Option D's scale (62×4=248, which is the y-axis max for x=4).

Snap & solve any problem in the app
Get step-by-step solutions on Sovi AI
Photo-based solutions with guided steps
Explore more problems and detailed explanations
a. $y = 62x$
b. Option D. Car X (graph with y-axis labeled 248 Distance (mi), x-axis Time (hr), line passing through (0,0) and (4,248)). This graph has a slope of 62, which equals the car's speed, so it correctly represents the linear relationship $y=62x$ where distance increases by 62 miles per hour of travel.