QUESTION IMAGE
Question
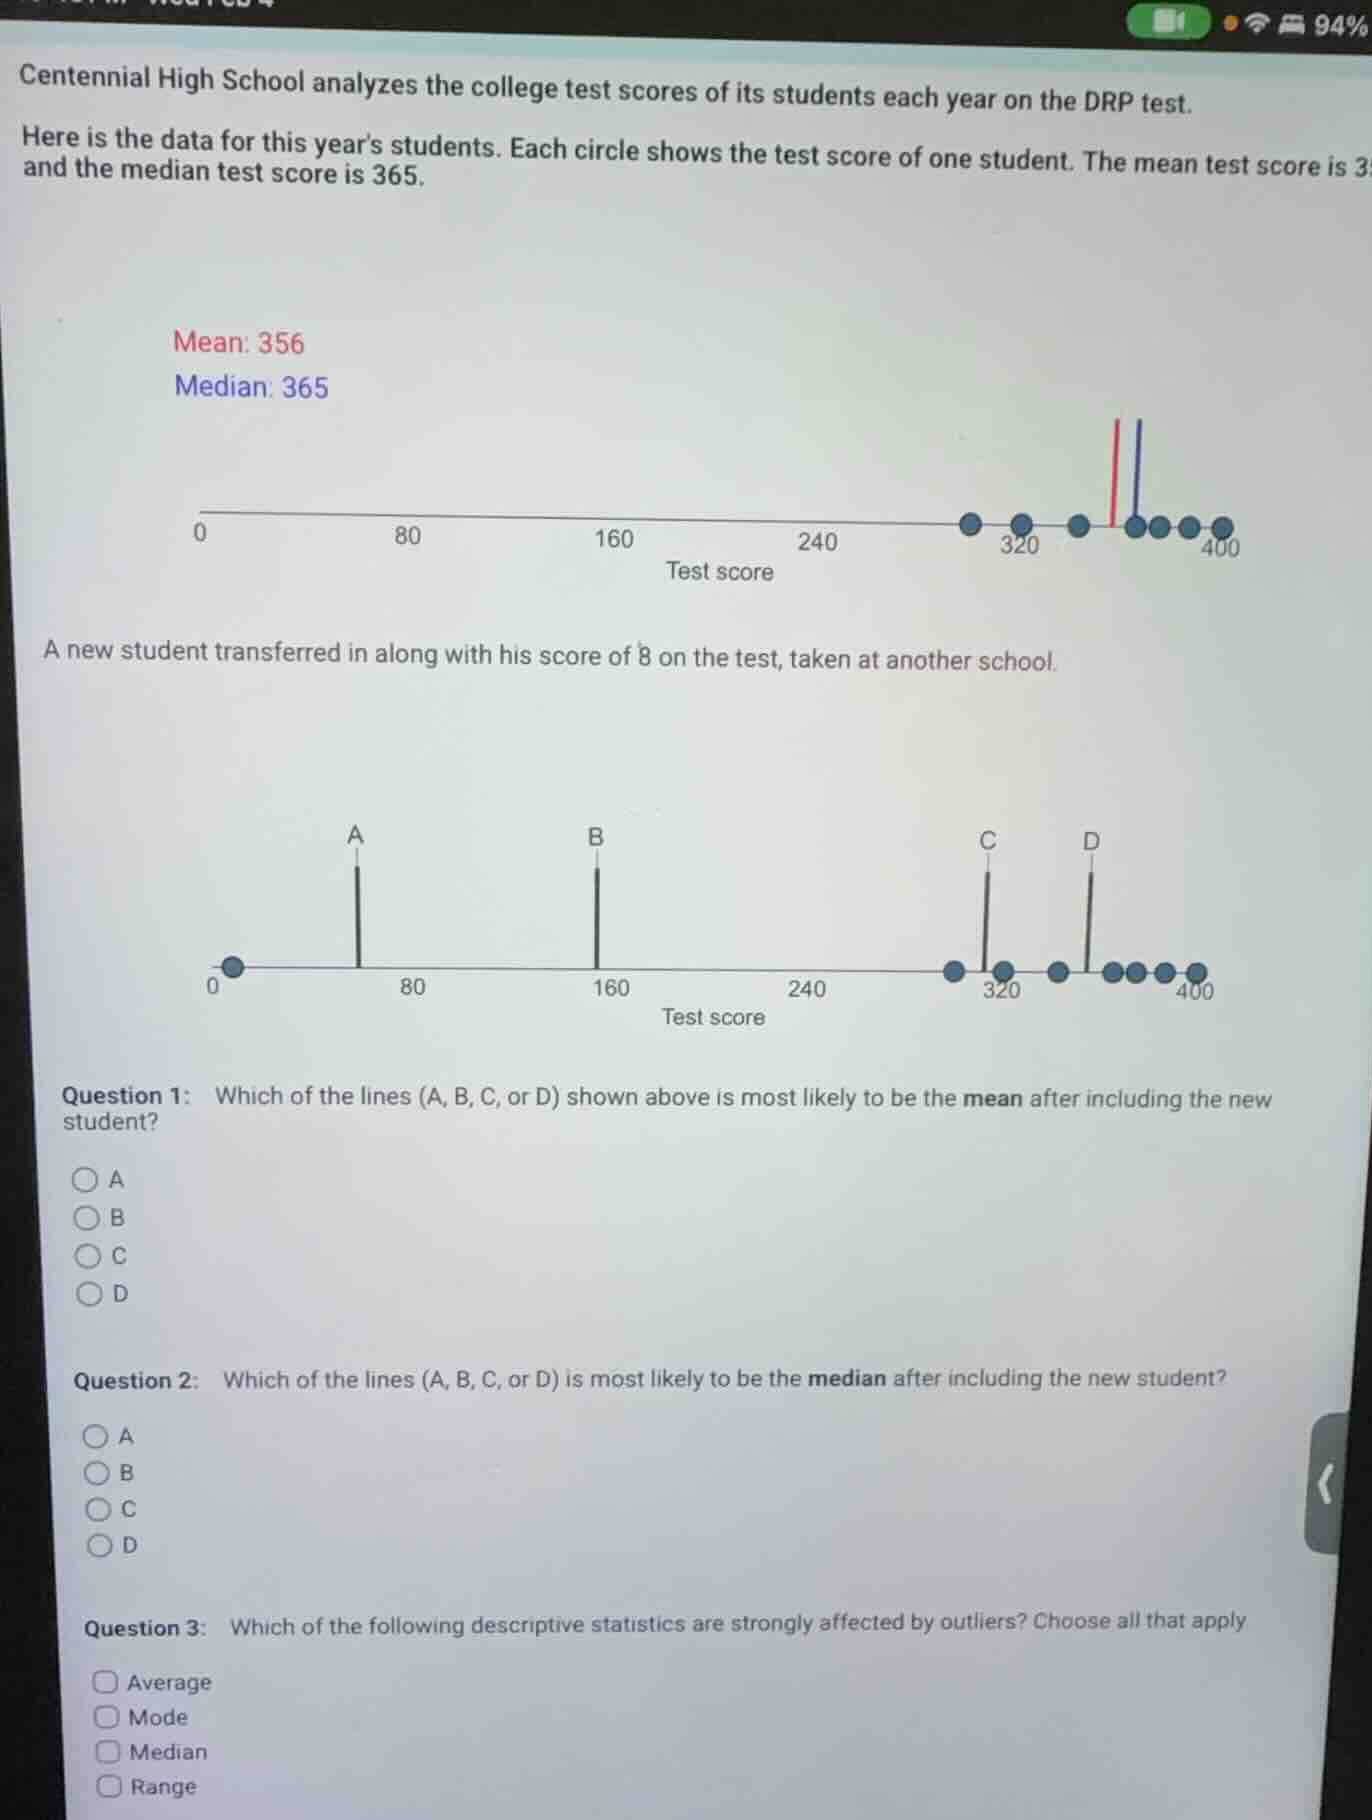
centennial high school analyzes the college test scores of its students each year on the drp test. here is the data for this year’s students. each circle shows the test score of one student. the mean test score is 356 and the median test score is 365. a new student transferred in along with his score of 8 on the test, taken at another school. question 1: which of the lines (a, b, c, or d) shown above is most likely to be the mean after including the new student? a b c d question 2: which of the lines (a, b, c, or d) is most likely to be the median after including the new student? a b c d question 3: which of the following descriptive statistics are strongly affected by outliers? choose all that apply average mode median range
Step1: Count original number of students
Count the data points: 8 students (from the first dot plot: 300, 320, 340, 360, 370, 380, 390, 400)
Step2: Calculate original total score
Original mean = 356, so total score = $356 \times 8 = 2848$
Step3: Calculate new total and student count
New total score = $2848 + 8 = 2856$; new count = $8 + 1 = 9$
Step4: Compute new mean
New mean = $\frac{2856}{9} \approx 317.33$
Step5: Determine new median
Original data sorted: [300, 320, 340, 360, 370, 380, 390, 400]; median is average of 4th/5th = 365. New sorted data: [8, 300, 320, 340, 360, 370, 380, 390, 400]; median is 5th value = 360
Step6: Identify outlier-sensitive stats
Mean (average) and range are affected by outliers; median and mode are not.

Snap & solve any problem in the app
Get step-by-step solutions on Sovi AI
Photo-based solutions with guided steps
Explore more problems and detailed explanations
Question 1: B. Line B
Question 2: C. Line C
Question 3: Average, Range