QUESTION IMAGE
Question
check
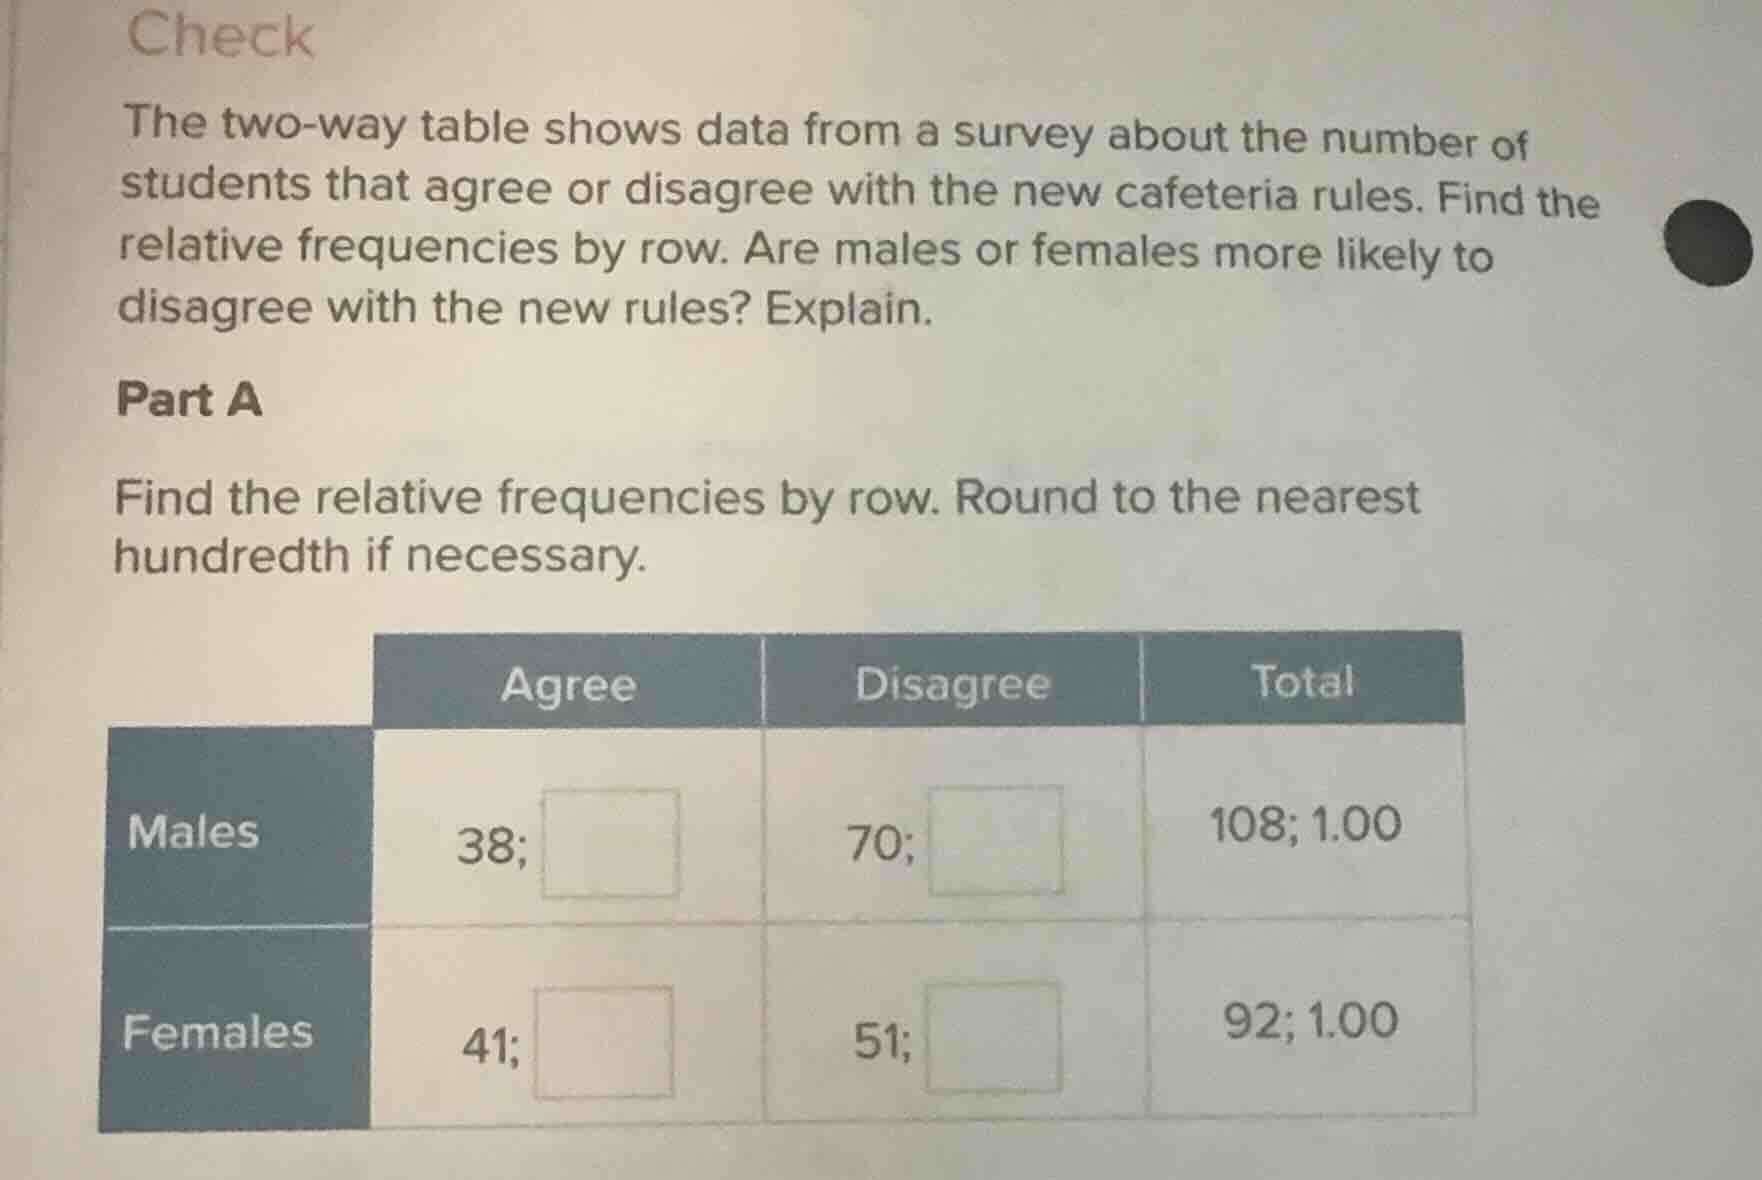
the two - way table shows data from a survey about the number of students that agree or disagree with the new cafeteria rules. find the relative frequencies by row. are males or females more likely to disagree with the new rules? explain.
part a
find the relative frequencies by row. round to the nearest hundredth if necessary.
| agree | disagree | total | |
|---|---|---|---|
| females | 41; | 51; | 92; 1.00 |
Step1: Calculate male agree relative freq.
$\frac{38}{108} \approx 0.35$
Step2: Calculate male disagree relative freq.
$\frac{70}{108} \approx 0.65$
Step3: Calculate female agree relative freq.
$\frac{41}{92} \approx 0.45$
Step4: Calculate female disagree relative freq.
$\frac{51}{92} \approx 0.55$
Step5: Compare disagreement frequencies
Males: $0.65$, Females: $0.55$; $0.65 > 0.55$

Snap & solve any problem in the app
Get step-by-step solutions on Sovi AI
Photo-based solutions with guided steps
Explore more problems and detailed explanations
Relative Frequencies by Row:
- Males Agree: $0.35$
- Males Disagree: $0.65$
- Females Agree: $0.45$
- Females Disagree: $0.55$
Males are more likely to disagree with the new rules, as their relative frequency of disagreement ($0.65$) is higher than that of females ($0.55$).