QUESTION IMAGE
Question
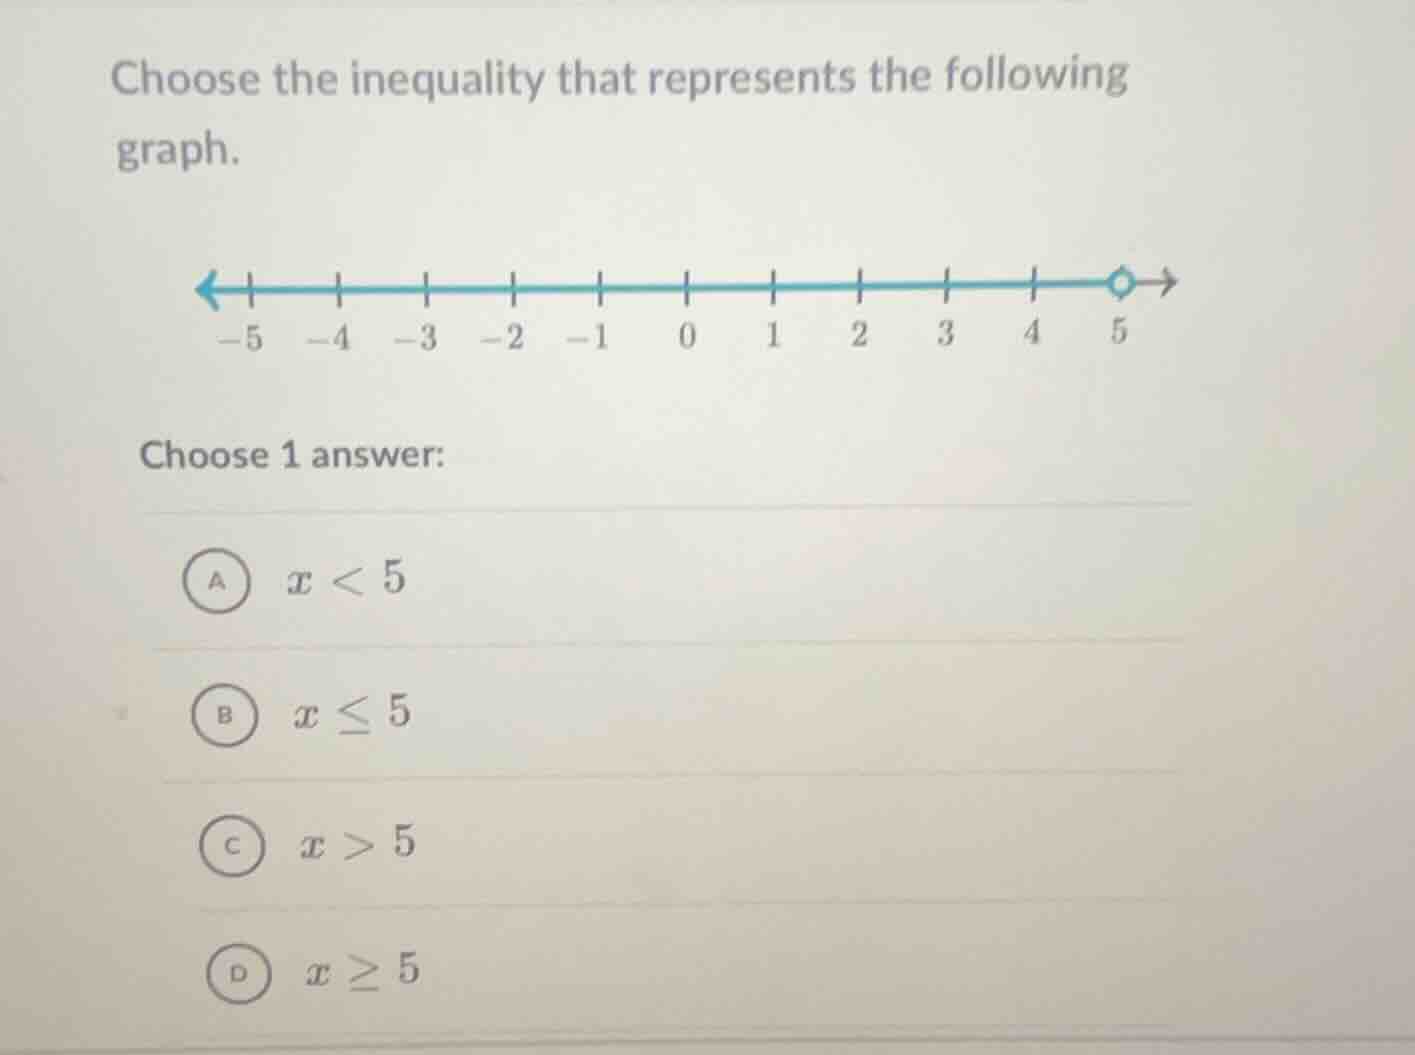
choose the inequality that represents the following graph.
(number line graph with an open circle at 5 and blue line pointing left)
choose 1 answer:
a ( x < 5 )
b ( x leq 5 )
c ( x > 5 )
d ( x geq 5 )
Step1: Analyze the graph's endpoint
The graph has an open circle at 5, so 5 is not included. Open circles mean the inequality is strict (no "or equal to").
Step2: Analyze the direction of the line
The line is shaded to the left of 5, which means we're looking for values less than 5. So the inequality should be \( x < 5 \).

Snap & solve any problem in the app
Get step-by-step solutions on Sovi AI
Photo-based solutions with guided steps
Explore more problems and detailed explanations
A. \( x < 5 \)