QUESTION IMAGE
Question
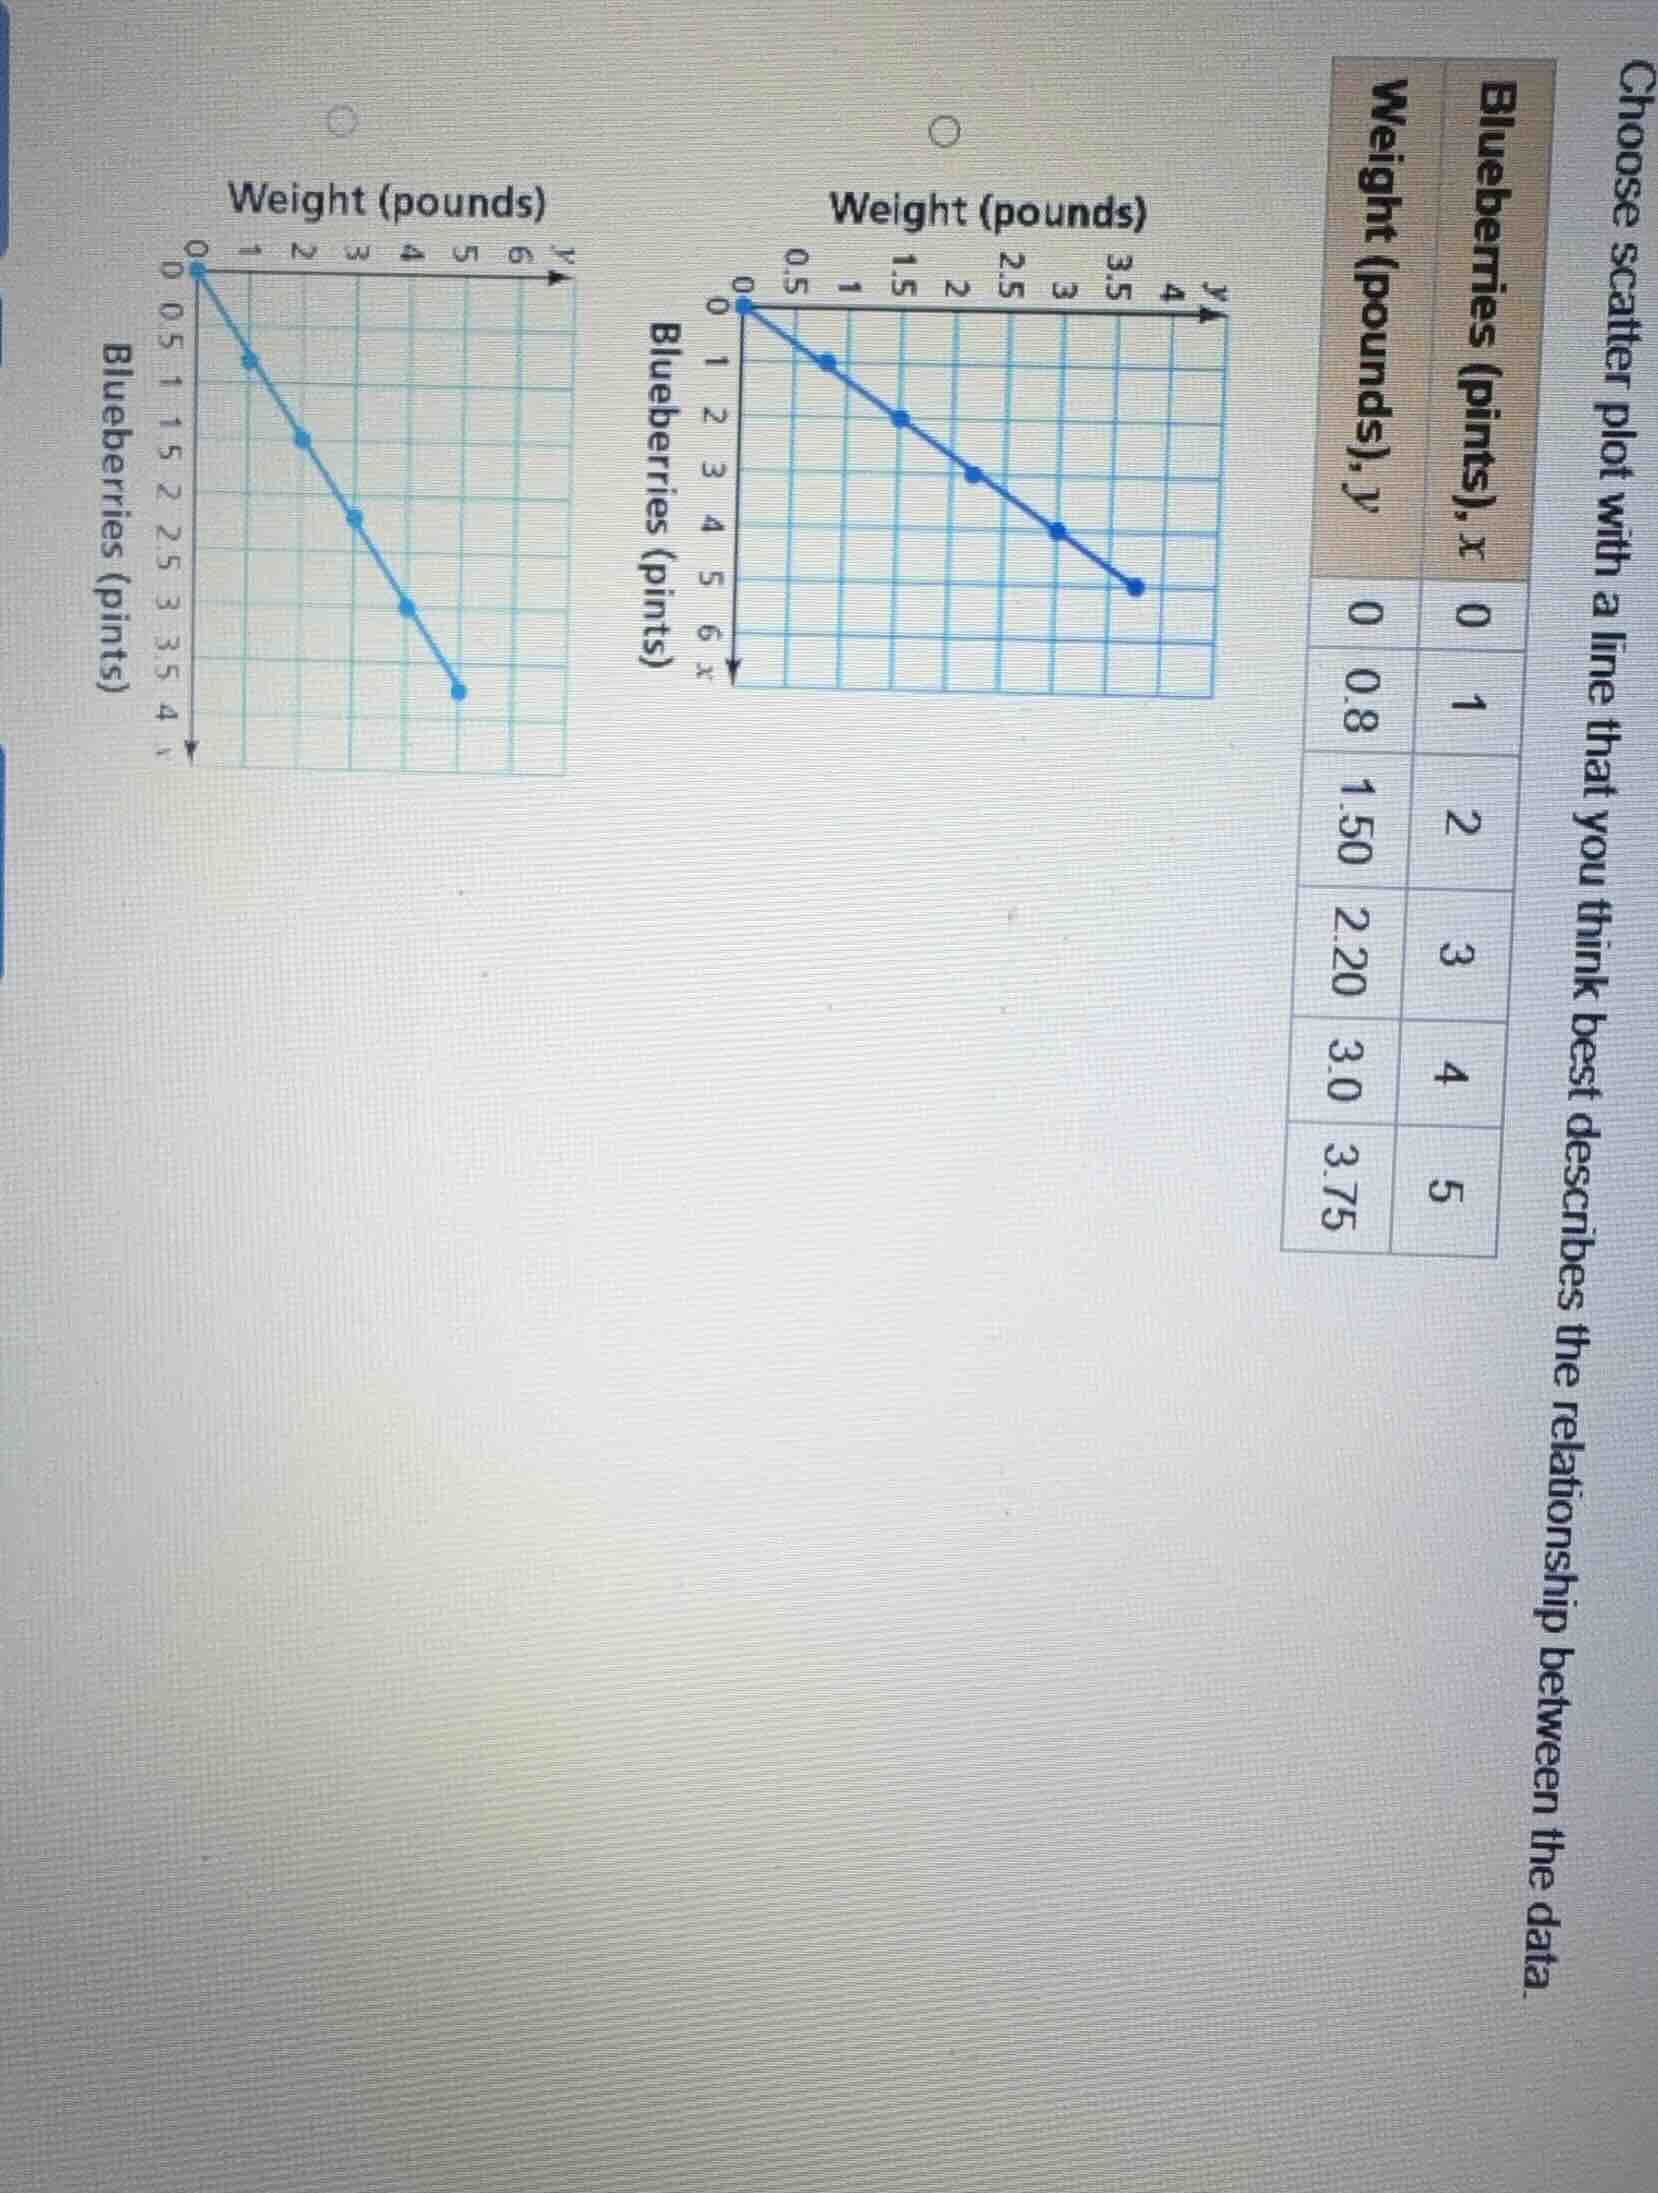
choose scatter plot with a line that you think best describes the relationship between the data.
blueberries (pints),x
weight (pounds),y
0 0
1 0.8
2 1.50
3 2.20
4 3.0
5 3.75
Step1: Identify data points
The data pairs are $(x,y)=(0,0), (1,0.8), (2,1.50), (3,2.20), (4,3.0), (5,3.75)$
Step2: Match points to plots
Check the right plot: $x$ (pints) is horizontal, $y$ (pounds) vertical. Its points align with the data: $(0,0), (1,0.8), (2,1.5), (3,2.2), (4,3.0), (5,3.75)$. The left plot swaps axes incorrectly.

Snap & solve any problem in the app
Get step-by-step solutions on Sovi AI
Photo-based solutions with guided steps
Explore more problems and detailed explanations
The correct scatter plot is the right one (with $x$-axis: Blueberries (pints), $y$-axis: Weight (pounds))