QUESTION IMAGE
Question
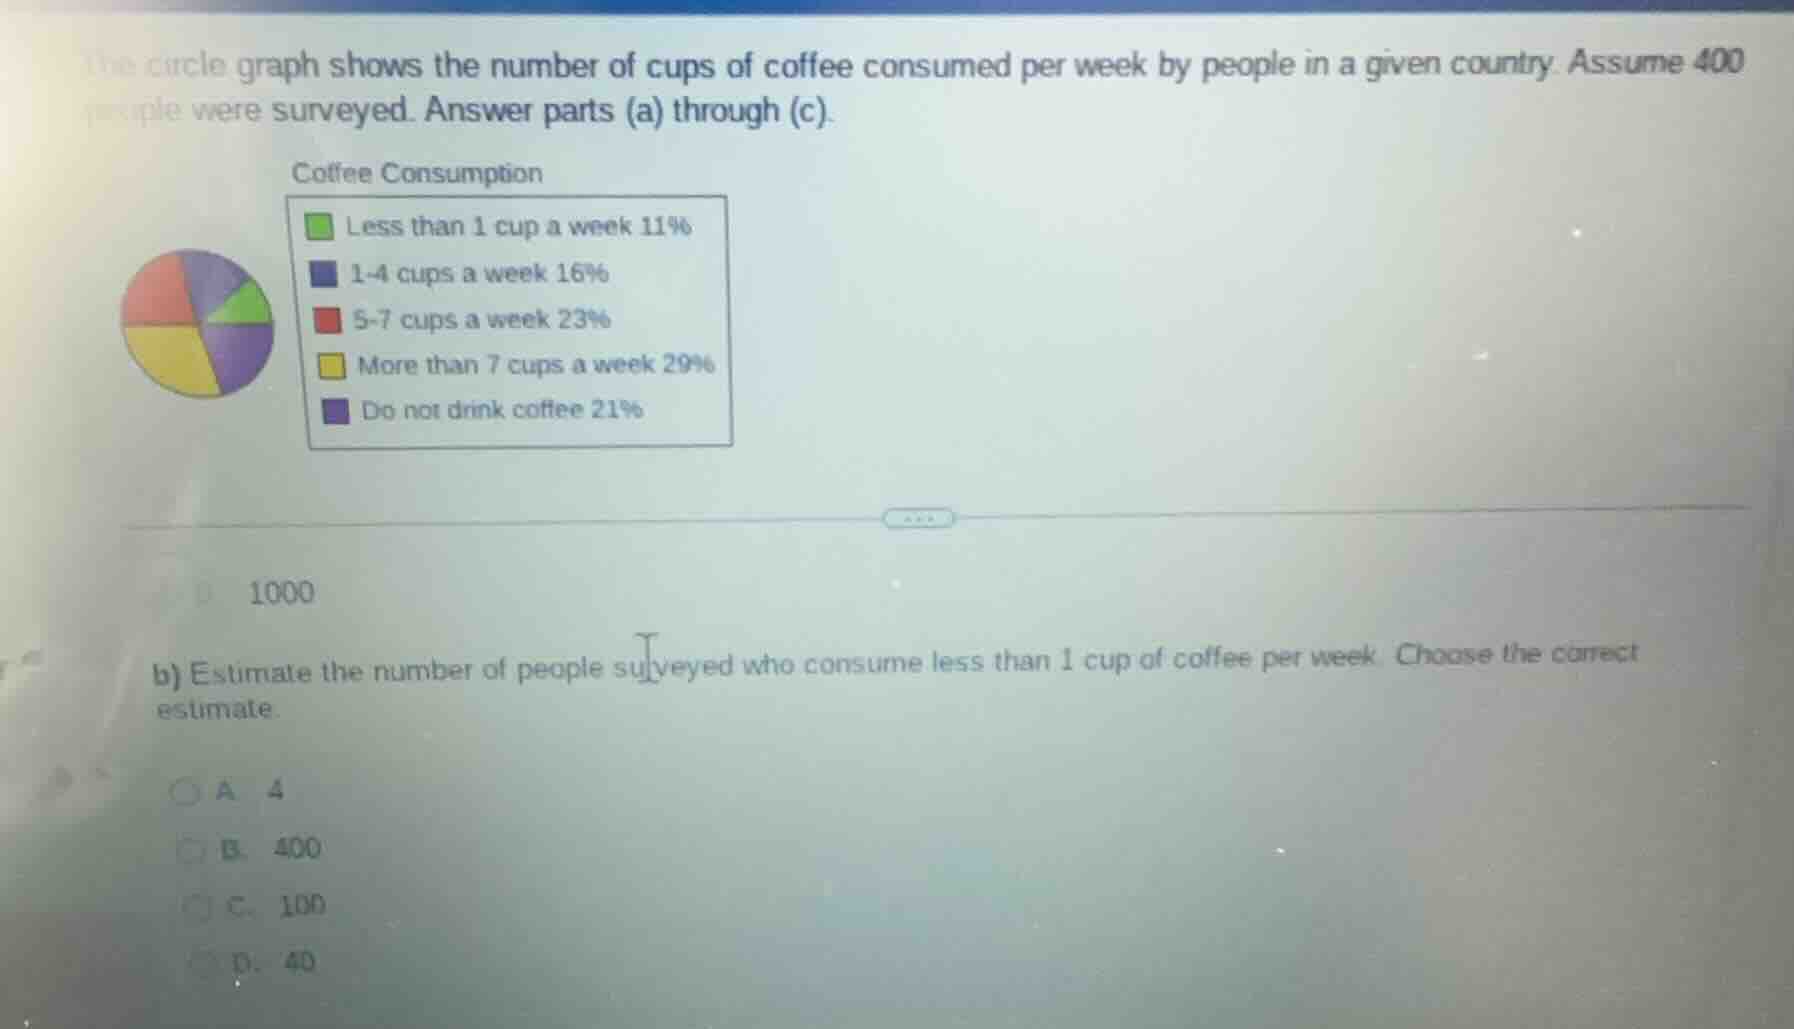
the circle graph shows the number of cups of coffee consumed per week by people in a given country. assume 400 people were surveyed. answer parts (a) through (c). coffee consumption less than 1 cup a week 11% 1-4 cups a week 16% 5-7 cups a week 23% more than 7 cups a week 29% do not drink coffee 21% b) estimate the number of people surveyed who consume less than 1 cup of coffee per week. choose the correct estimate. a. 4 b. 400 c. 100 d. 40
Step1: Identify given values
Total surveyed: $n=400$, percentage: $11\% = 0.11$
Step2: Calculate number of people
Multiply total by percentage: $400 \times 0.11 = 44$, which is closest to 40.

Snap & solve any problem in the app
Get step-by-step solutions on Sovi AI
Photo-based solutions with guided steps
Explore more problems and detailed explanations
D. 40