QUESTION IMAGE
Question
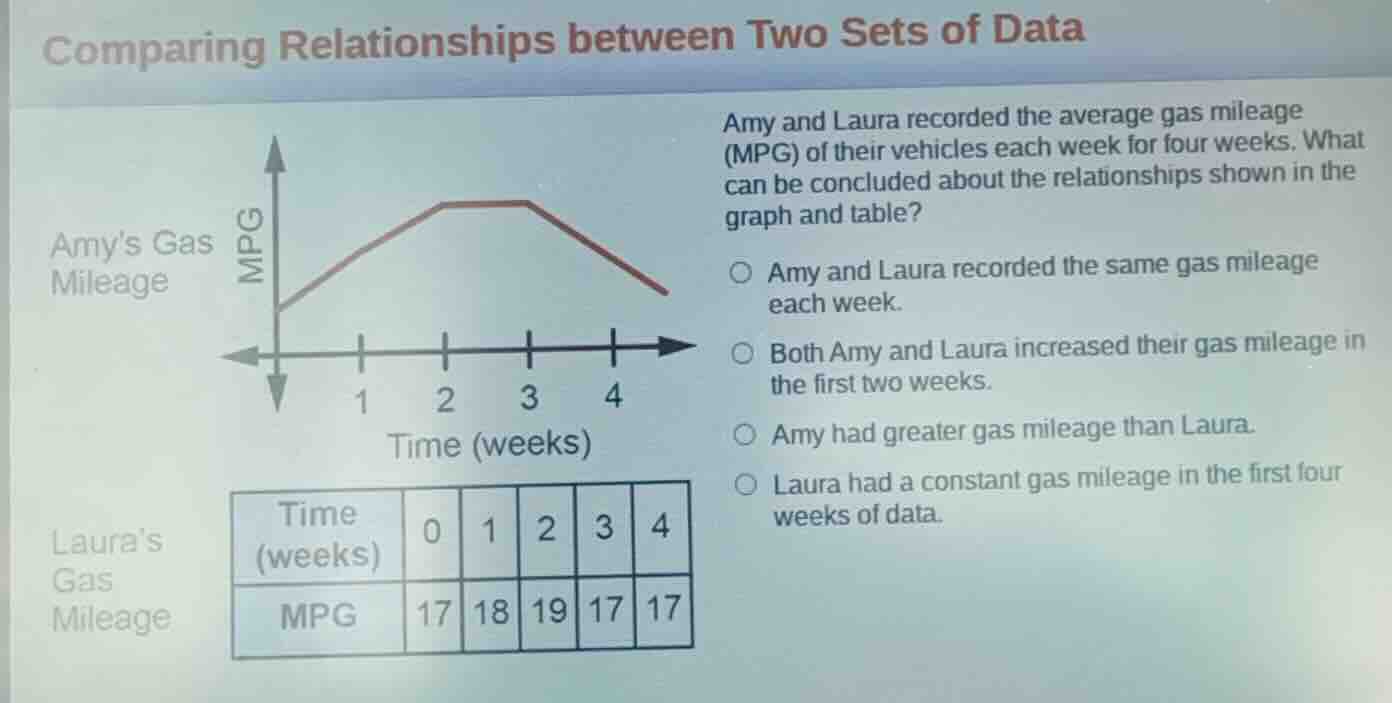
comparing relationships between two sets of data
amys gas mileage
lauras gas mileage
amy and laura recorded the average gas mileage (mpg) of their vehicles each week for four weeks. what can be concluded about the relationships shown in the graph and table?
○ amy and laura recorded the same gas mileage each week.
○ both amy and laura increased their gas mileage in the first two weeks.
○ amy had greater gas mileage than laura.
○ laura had a constant gas mileage in the first four weeks of data.
| time (weeks) | 0 | 1 | 2 | 3 | 4 |
|---|
Brief Explanations
- Check Amy's graph: Her MPG rises from week 0 to week 2, so it increases in the first two weeks.
- Check Laura's table: Her MPG goes from 17 (week 0) to 18 (week 1) to 19 (week 2), so it also increases in the first two weeks.
- Eliminate other options:
- Option A is false: Their values do not match each week (e.g., week 3 Amy's MPG is higher than Laura's 17).
- Option C is false: We do not know Amy's exact MPG values, only the trend, so we cannot confirm this.
- Option D is false: Laura's MPG changes (17→18→19→17→17), so it is not constant.

Snap & solve any problem in the app
Get step-by-step solutions on Sovi AI
Photo-based solutions with guided steps
Explore more problems and detailed explanations
B. Both Amy and Laura increased their gas mileage in the first two weeks.