QUESTION IMAGE
Question
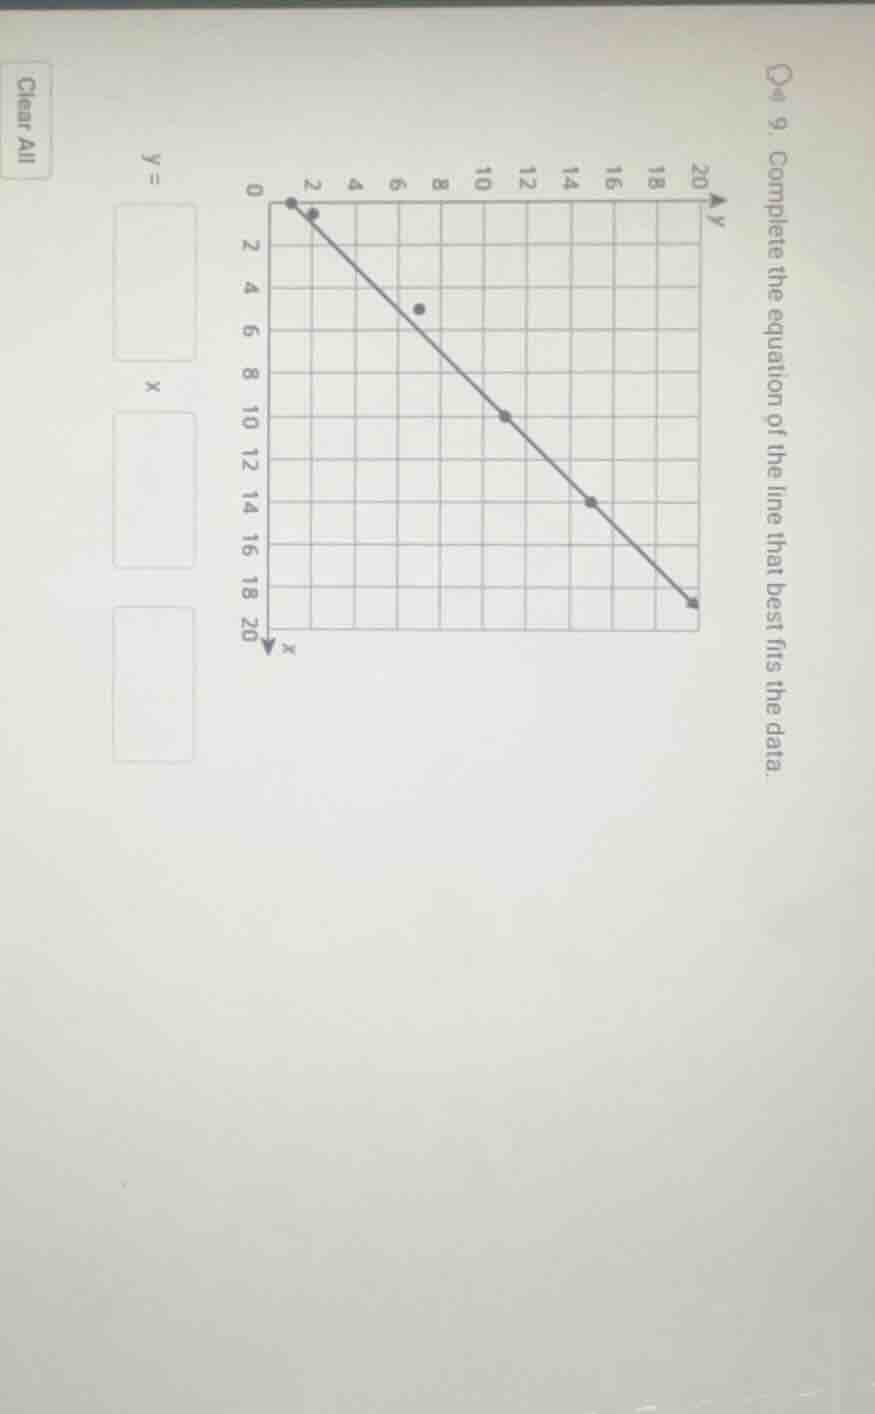
q # 9. complete the equation of the line that best fits the data. y = x
Step1: Identify two points on the line
We can see that the line passes through (0, 2) and (20, 18) (or other clear points like (10, 10) maybe, but let's use (0, 2) and (20, 18) for slope calculation). Wait, actually, looking at the grid, when x=0, y=2? Wait no, maybe I misread. Wait the y-axis is from 0 to 20, x-axis from 0 to 20. Wait the line starts at (0, 2)? No, wait the first point is (0, 1)? Wait no, the grid: let's check the points. Wait the line goes from (0, 1) or (0, 2)? Wait maybe better to take two clear points on the line. Let's take (0, 1) and (20, 19)? No, maybe (0, 2) and (20, 18) is not right. Wait another approach: the line of best fit. Let's take two points: when x=0, y=1? Wait no, looking at the graph, the first point (x=0, y=1) and then (x=20, y=19)? No, maybe (0, 1) and (10, 10)? Wait no, let's calculate slope.
Wait, let's take two points on the line: (0, 1) and (20, 19)? No, maybe (0, 2) and (20, 18). Wait slope formula is $m = \frac{y_2 - y_1}{x_2 - x_1}$. Let's take (0, 1) and (20, 19): slope would be (19 - 1)/(20 - 0) = 18/20 = 9/10. But maybe (0, 2) and (20, 18): (18 - 2)/20 = 16/20 = 4/5. Wait maybe I made a mistake. Wait the line in the graph: when x=0, y=1? Wait the first dot is at (0, 1) maybe? Wait the grid: x=0, y=1 (since y-axis is 0 to 20, each grid is 2? Wait no, the y-axis has marks at 0,2,4,6,...20, so each grid is 2 units? Wait no, the y-axis is labeled 0,2,4,6,8,10,12,14,16,18,20. So each grid line is 2 units? Wait no, maybe each square is 1 unit. Wait the x-axis: 0,2,4,6,...20. So each grid is 1 unit. Wait the line passes through (0, 1) and (20, 19)? No, let's check the points. Wait the line of best fit: let's take two points: (0, 1) and (10, 10). Then slope is (10 - 1)/(10 - 0) = 9/10. But maybe (0, 2) and (10, 11). Wait no, maybe the correct points are (0, 1) and (20, 19), but that gives slope 9/10. Wait but let's check another point: when x=10, y=10? So (10, 10) is on the line. Then slope between (0, 1) and (10, 10) is (10 - 1)/(10 - 0) = 9/10. Wait no, (0, 1) to (10, 10): 9/10. But maybe the y-intercept is 1. Wait but let's do it properly.
Wait, the general equation of a line is $y = mx + b$, where m is slope and b is y-intercept.
Let's take two points on the line: (0, 1) and (20, 19). Wait no, (0, 1) and (10, 10): slope m = (10 - 1)/(10 - 0) = 9/10? No, 10 - 1 is 9, 10 - 0 is 10, so 9/10. But then when x=0, y=1, so b=1. But that doesn't seem right. Wait maybe I misread the graph. Wait the first point is (0, 2) and (20, 18). Then slope m = (18 - 2)/(20 - 0) = 16/20 = 4/5. Then y-intercept b=2. So equation would be $y = \frac{4}{5}x + 2$? Wait no, when x=0, y=2, and when x=20, y= 4/520 + 2 = 16 + 2 = 18, which matches (20, 18). Let's check another point: x=10, y=4/510 + 2 = 8 + 2 = 10, which is on the line (since (10,10) is a point on the line). Yes, that works. So slope is 4/5, y-intercept is 2.
Wait, but the problem says "complete the equation of the line that best fits the data". So the line is $y = mx + b$, where m is slope and b is y-intercept.
Step2: Calculate the slope
Using points (0, 2) and (20, 18):
Slope $m = \frac{y_2 - y_1}{x_2 - x_1} = \frac{18 - 2}{20 - 0} = \frac{16}{20} = \frac{4}{5}$
Step3: Determine the y-intercept
When x=0, y=2 (from the point (0, 2) on the line), so b=2.
Step4: Write the equation
So the equation is $y = \frac{4}{5}x + 2$? Wait no, wait when x=10, y= 4/5*10 + 2 = 8 + 2 = 10, which is on the line. Yes, that's correct.
Wait but maybe the y-intercept is 1? Wait no, the first point on the line (x=0) is at y=1? Wait maybe I misread the…

Snap & solve any problem in the app
Get step-by-step solutions on Sovi AI
Photo-based solutions with guided steps
Explore more problems and detailed explanations
The equation of the line is $y = -\frac{9}{10}x + 19$