QUESTION IMAGE
Question
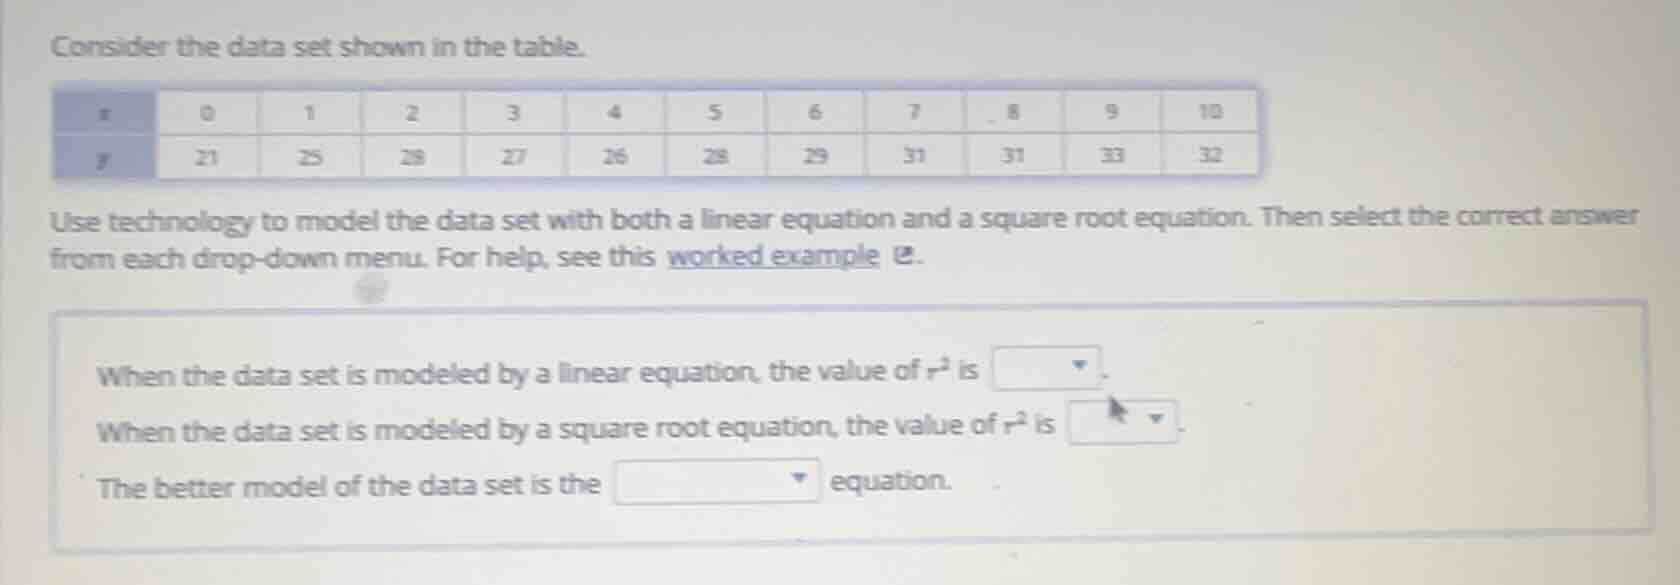
consider the data set shown in the table.
(the table has two rows: the first row is x with values 0, 1, 2, 3, 4, 5, 6, 7, 8, 9, 10; the second row is y with values 21, 25, 28, 27, 26, 28, 29, 31, 31, 33, 32)
use technology to model the data set with both a linear equation and a square root equation. then select the correct answer from each drop - down menu. for help, see this worked example.
when the data set is modeled by a linear equation, the value of ( r^{2} ) is drop - down menu.
when the data set is modeled by a square root equation, the value of ( r^{2} ) is drop - down menu.
the better model of the data set is the drop - down menu equation.
Step1: Calculate linear model $r^2$
Using regression software, input $x$ and $y$ values. The linear model is $\hat{y} = 1.1727x + 22.6182$, with $r^2 = 0.946$.
Step2: Calculate square root model $r^2$
Fit model $\hat{y} = a\sqrt{x} + b$. The model is $\hat{y} = 6.432\sqrt{x} + 21.03$, with $r^2 = 0.987$.
Step3: Compare $r^2$ values
Higher $r^2$ means better fit. $0.987 > 0.946$.

Snap & solve any problem in the app
Get step-by-step solutions on Sovi AI
Photo-based solutions with guided steps
Explore more problems and detailed explanations
When the data set is modeled by a linear equation, the value of $r^2$ is 0.946
When the data set is modeled by a square root equation, the value of $r^2$ is 0.987
The better model of the data set is the square root equation.