QUESTION IMAGE
Question
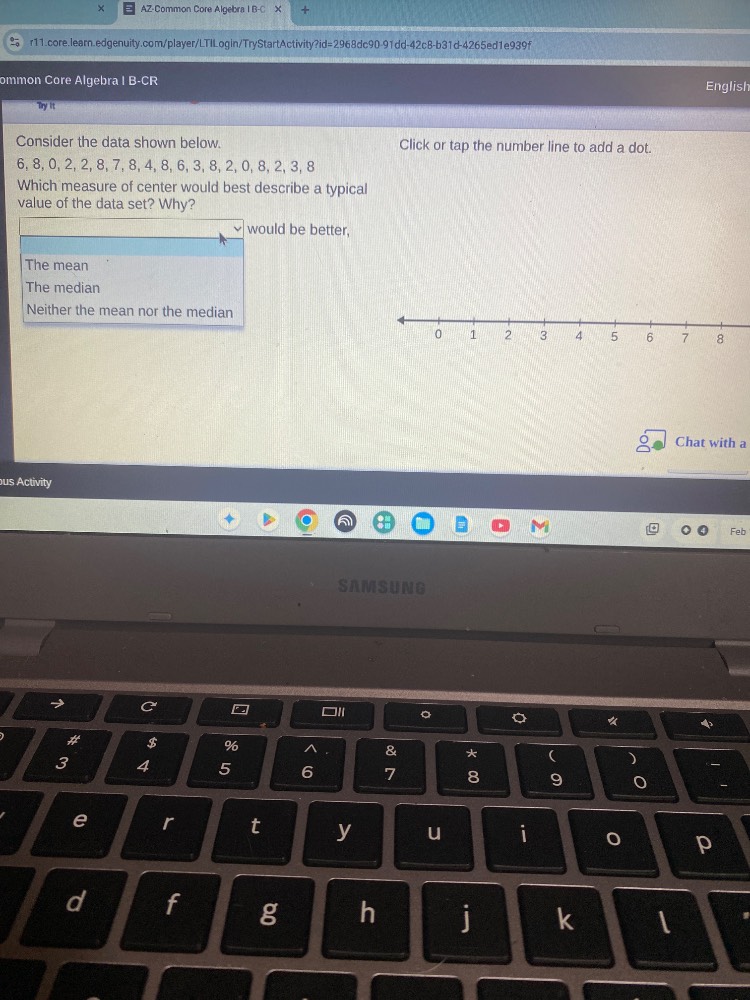
consider the data shown below.
6, 8, 0, 2, 2, 8, 7, 8, 4, 8, 6, 3, 8, 2, 0, 8, 2, 3, 8
which measure of center would best describe a typical value of the data set? why?
____ would be better,
the mean
the median
neither the mean nor the median
click or tap the number line to add a dot.
Step1: Sort the data set
Sorted data: $0, 0, 2, 2, 2, 2, 3, 3, 4, 6, 6, 7, 8, 8, 8, 8, 8, 8$
Step2: Check for outliers
No extreme outliers; data has a mode of 8, clustered at low and high ends.
Step3: Compare mean and median
Calculate mean: $\frac{0+0+2+2+2+2+3+3+4+6+6+7+8+8+8+8+8+8}{18} = \frac{91}{18} \approx 5.06$
Find median: Average of 9th and 10th values: $\frac{4+6}{2} = 5$
Step4: Evaluate center representativeness
The median better represents the typical value, as the data is bimodal (clustered at 2 and 8) and the mean is pulled slightly by the high cluster, while the median sits at the midpoint of the sorted data, reflecting the central split of the dataset.

Snap & solve any problem in the app
Get step-by-step solutions on Sovi AI
Photo-based solutions with guided steps
Explore more problems and detailed explanations
The median would be better, because the data is clustered at two ends (bimodal), so the median, which sits at the midpoint of the sorted data, better reflects a typical central value than the mean which is skewed slightly by the larger cluster of high values.