QUESTION IMAGE
Question
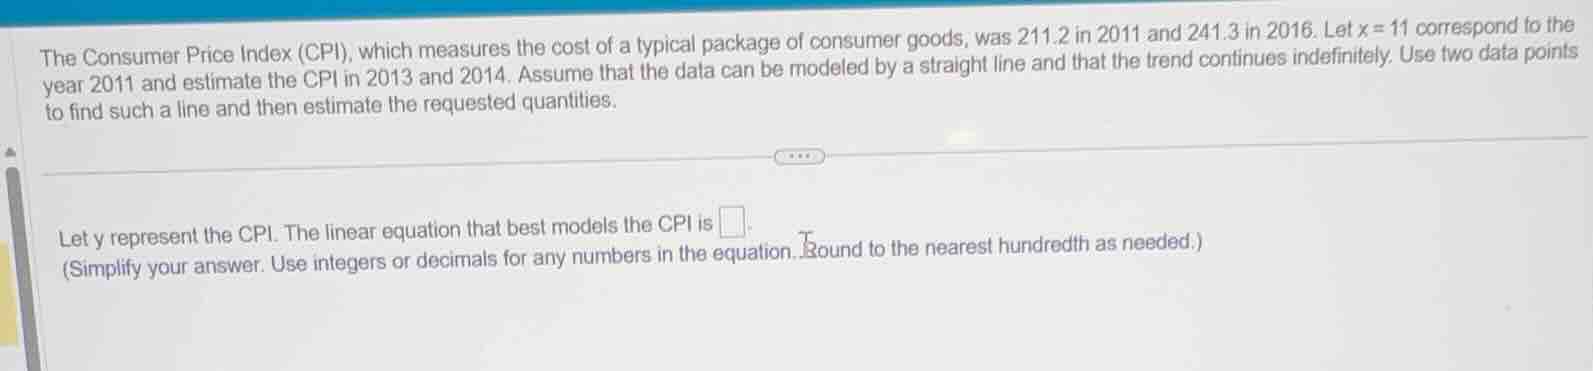
the consumer price index (cpi), which measures the cost of a typical package of consumer goods, was 211.2 in 2011 and 241.3 in 2016. let $x = 11$ correspond to the year 2011 and estimate the cpi in 2013 and 2014. assume that the data can be modeled by a straight line and that the trend continues indefinitely. use two data points to find such a line and then estimate the requested quantities.
let $y$ represent the cpi. the linear equation that best models the cpi is
(simplify your answer. use integers or decimals for any numbers in the equation. round to the nearest hundredth as needed.)
Step1: Define data points
We have two points: when $x=11$ (2011), $y=211.2$; when $x=16$ (2016), $y=241.3$.
Step2: Calculate slope $m$
Slope formula: $m=\frac{y_2-y_1}{x_2-x_1}$
$$m=\frac{241.3-211.2}{16-11}=\frac{30.1}{5}=6.02$$
Step3: Find y-intercept $b$
Use point-slope form $y-y_1=m(x-x_1)$, substitute $x_1=11, y_1=211.2, m=6.02$:
$$211.2=6.02\times11 + b$$
$$211.2=66.22 + b$$
$$b=211.2-66.22=144.98$$
Step4: Write linear equation
Substitute $m$ and $b$ into $y=mx+b$.

Snap & solve any problem in the app
Get step-by-step solutions on Sovi AI
Photo-based solutions with guided steps
Explore more problems and detailed explanations
$y=6.02x + 144.98$