QUESTION IMAGE
Question
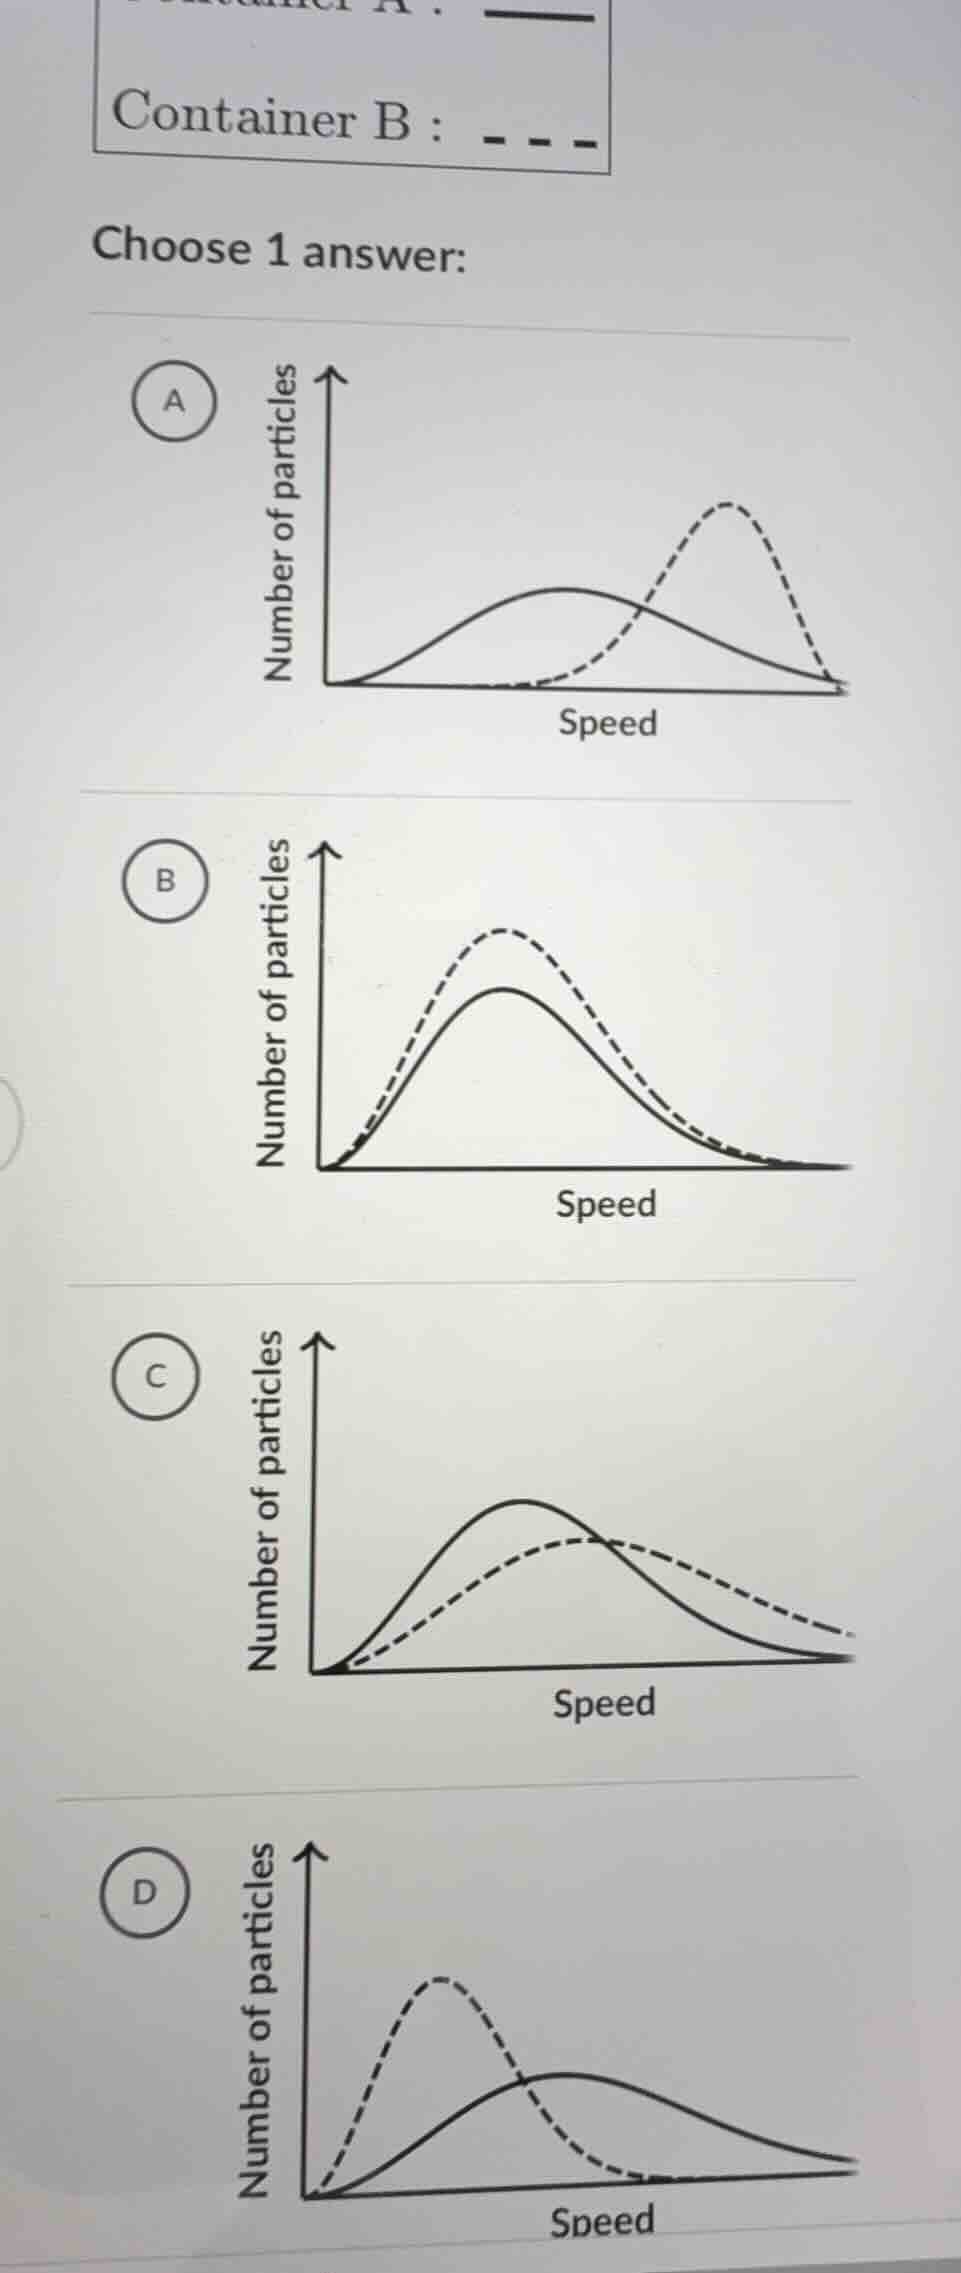
container b :
choose 1 answer:
To determine the correct answer, we analyze the particle speed distribution graphs. The key is to identify the graph where the two curves (for Container A and B) show a reasonable shift in particle speed distribution (e.g., due to temperature or other factors affecting particle kinetic energy). Option A shows two curves with different peak positions and distributions, which is consistent with how particle speed distributions change (e.g., higher temperature leading to a broader, shifted distribution). Other options either have overlapping peaks in a less consistent way or incorrect shapes.

Snap & solve any problem in the app
Get step-by-step solutions on Sovi AI
Photo-based solutions with guided steps
Explore more problems and detailed explanations
A. The graph with two curves (solid and dashed) showing different peak positions and distributions of particle speed.