QUESTION IMAGE
Question
cool down: beginning to see daylight
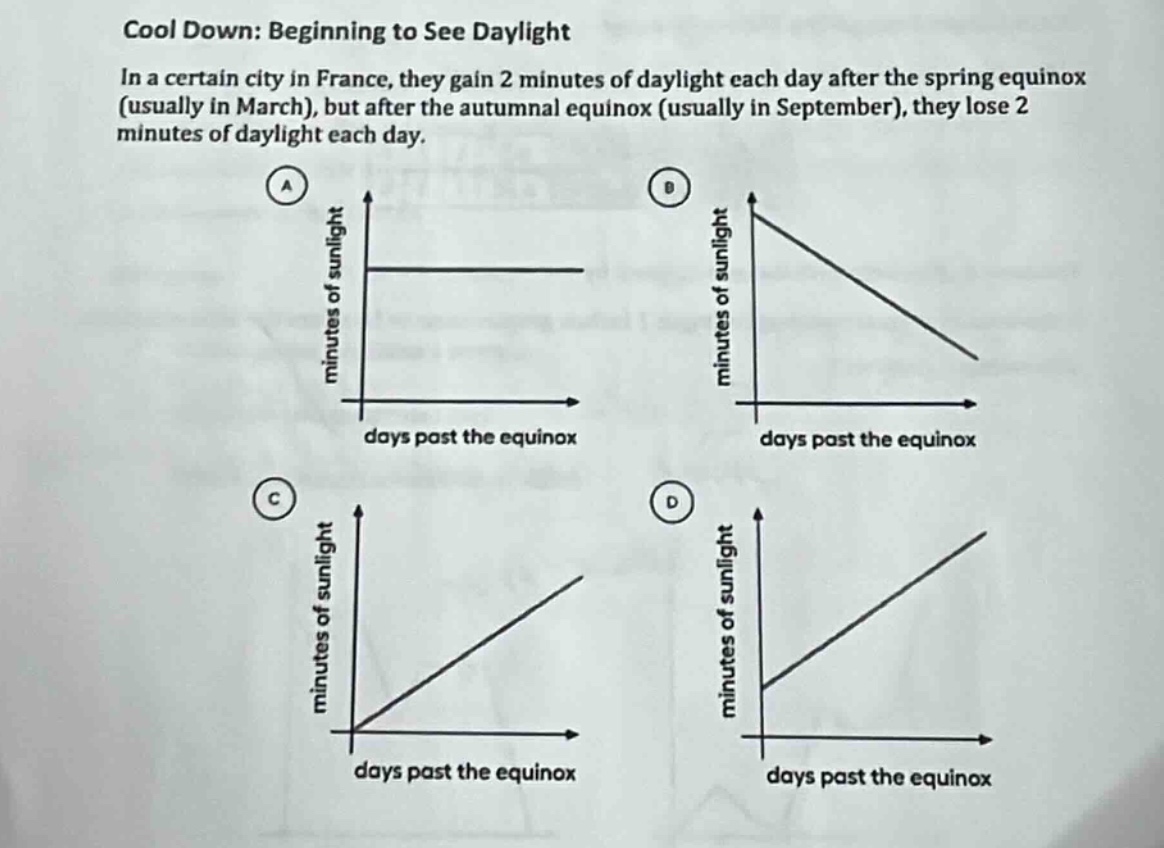
in a certain city in france, they gain 2 minutes of daylight each day after the spring equinox (usually in march), but after the autumnal equinox (usually in september), they lose 2 minutes of daylight each day.
there are four graphs labeled a, b, c, d. graph a: a horizontal line, x - axis is days past the equinox, y - axis is minutes of sunlight. graph b: a line with negative slope, x - axis is days past the equinox, y - axis is minutes of sunlight. graph c: a line with positive slope passing through the origin, x - axis is days past the equinox, y - axis is minutes of sunlight. graph d: a line with positive slope with y - intercept above the origin, x - axis is days past the equinox, y - axis is minutes of sunlight.
To solve this, we analyze the relationship between daylight minutes and days past the equinox:
Step 1: Interpret the Spring Equinox (Gain 2 min/day)
After the spring equinox, daylight increases by 2 minutes per day. This means the graph of minutes of sunlight vs. days past the equinox should be a line with a positive slope (since as days increase, daylight increases).
Step 2: Analyze the Autumn Equinox (Lose 2 min/day)
After the autumnal equinox, daylight decreases by 2 minutes per day. This would be a line with a negative slope, but the question focuses on the pattern after an equinox (either spring or autumn—we analyze the options).
Step 3: Evaluate the Graphs
- Graph A: Horizontal line (slope = 0). This implies daylight is constant, which does not match “gain” or “lose” 2 minutes per day. Eliminate A.
- Graph B: Line with negative slope (decreasing). This matches the autumn equinox (losing daylight), but let’s check the spring equinox pattern too.
- Graph C: Line with positive slope, passing through the origin (0,0). If we assume the equinox starts at 0 minutes of change (e.g., spring equinox: initial daylight is constant, then gains 2 min/day), but the problem says “gain 2 minutes each day after the equinox”—so the initial value (at day 0) could be the baseline, and then increases. However, Graph D starts at a positive y - intercept. Wait, no—let’s re - clarify:
- For the spring equinox: At day 0 (equinox), the daylight is a baseline. Then, each day, it gains 2 minutes. So the equation is \( y = 2x + b \), where \( b \) is the baseline daylight at day 0.
- Graph D: Positive y - intercept (starts above 0) and positive slope (increasing). This matches: at day 0 (equinox), there is a baseline of daylight, and each day after, it gains 2 minutes (so \( y \) increases as \( x \) increases).
- Graph C: Passes through (0,0), implying 0 daylight at day 0, which is unrealistic.
Wait, maybe the question is simplified: “gain 2 minutes each day after the equinox” means the relationship is linear with positive slope. Let's re - evaluate:
- Spring Equinox Pattern: Daylight increases by 2 min/day. So the graph should have a positive slope (as days increase, daylight increases).
- Autumn Equinox Pattern: Daylight decreases by 2 min/day (negative slope).
But the options:
- Graph D: Positive slope (increasing) with a positive y - intercept (baseline daylight at day 0, then gains 2 min/day). This matches “gain 2 minutes each day after the equinox” (since after day 0, it increases).
- Graph C: Positive slope but passes through (0,0). If we assume the equinox is when daylight starts changing from 0, but that’s less realistic. However, maybe the problem is simplified: “gain 2 minutes each day” means the rate of change is +2, so the graph is a line with positive slope.
Wait, the key is: “gain 2 minutes of daylight each day after the equinox” → the number of minutes of sunlight is a linear function with a positive slope (since days past equinox \( x \) and minutes of sunlight \( y \) have \( y = 2x + c \), \( c \) is constant at day 0).
Looking at the graphs:
- A: Horizontal (slope 0) → no.
- B: Negative slope → no (for spring equinox).
- C: Positive slope, passes through (0,0) → if “after the equinox” means day 0 is the equinox, and at day 0, the change is 0, then each day adds 2 minutes. But does the city start with 0 daylight? Unlikely.
- D: Positive slope, starts above 0 → at day 0 (equinox), there is a baseline of daylight, and each day after, it gains 2 minutes. This is more realistic.…

Snap & solve any problem in the app
Get step-by-step solutions on Sovi AI
Photo-based solutions with guided steps
Explore more problems and detailed explanations
D (the graph with a positive y - intercept and a positive slope, showing minutes of sunlight increasing as days past the equinox increase)