QUESTION IMAGE
Question
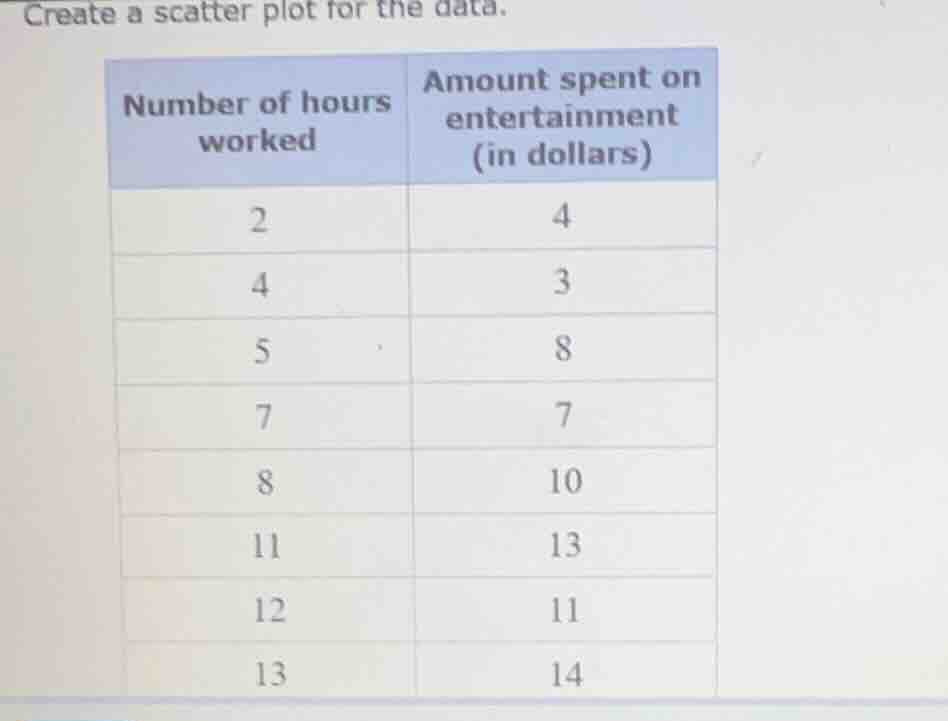
create a scatter plot for the data.
number of hours worked | amount spent on entertainment (in dollars)
2 | 4
4 | 3
5 | 8
7 | 7
8 | 10
11 | 13
12 | 11
13 | 14
Step1: Identify Variables
The independent variable (x - axis) is "Number of hours worked", and the dependent variable (y - axis) is "Amount spent on entertainment (in dollars)".
Step2: List Data Points
The data points are: (2, 4), (4, 3), (5, 8), (7, 7), (8, 10), (11, 13), (12, 11), (13, 14).
Step3: Set Up Axes
- x - axis: Label it "Number of hours worked". Choose a scale (e.g., from 0 to 15 with intervals of 1 or 2) to accommodate all x - values (2, 4, 5, 7, 8, 11, 12, 13).
- y - axis: Label it "Amount spent on entertainment (in dollars)". Choose a scale (e.g., from 0 to 15 with intervals of 1 or 2) to accommodate all y - values (3, 4, 7, 8, 10, 11, 13, 14).
Step4: Plot Points
For each data point (x, y), find the corresponding position on the x - axis and y - axis and mark a dot. For example:
- For (2, 4): Find 2 on the x - axis and 4 on the y - axis, then mark the point.
- Repeat this process for all the data points (4, 3), (5, 8), (7, 7), (8, 10), (11, 13), (12, 11), (13, 14).

Snap & solve any problem in the app
Get step-by-step solutions on Sovi AI
Photo-based solutions with guided steps
Explore more problems and detailed explanations
To create the scatter plot:
- Draw the x - axis (label: "Number of hours worked") and y - axis (label: "Amount spent on entertainment (in dollars)").
- Plot the points (2, 4), (4, 3), (5, 8), (7, 7), (8, 10), (11, 13), (12, 11), (13, 14) on the coordinate plane with the appropriate scales for the axes.