QUESTION IMAGE
Question
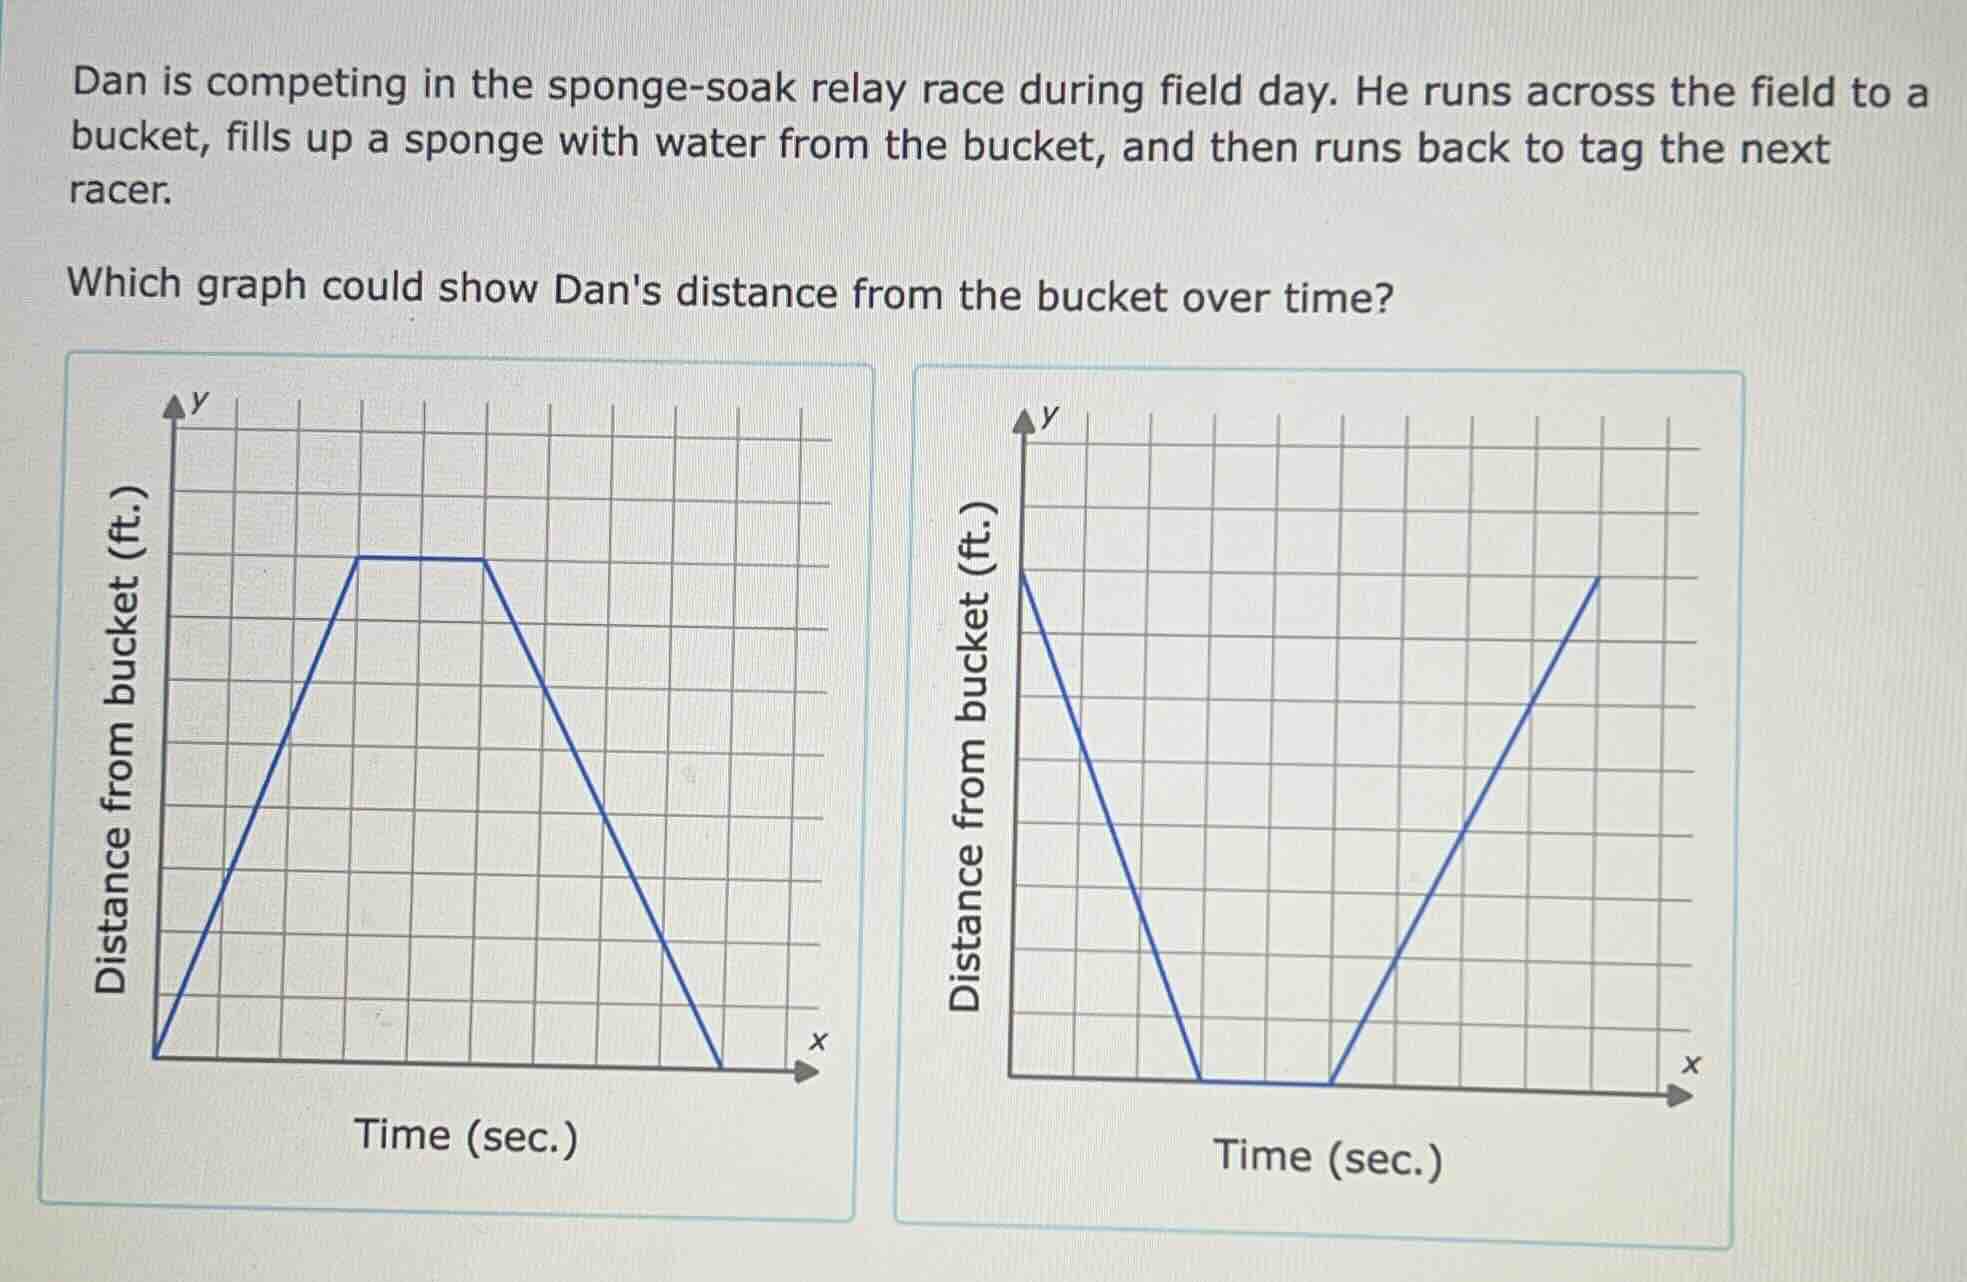
dan is competing in the sponge - soak relay race during field day. he runs across the field to a bucket, fills up a sponge with water from the bucket, and then runs back to tag the next racer. which graph could show dans distance from the bucket over time? two graphs are shown with y - axis labeled distance from bucket (ft.) and x - axis labeled time (sec.). the first graph has a line starting at the origin, increasing to a horizontal segment, then decreasing to the x - axis. the second graph has a line starting at a positive y - value, decreasing to the x - axis, then a horizontal segment, then increasing back to a positive y - value.
Step1: Analyze Dan's motion phases
Dan starts at the starting point (distance from bucket is some initial value? Wait, no—wait, when he starts, he runs towards the bucket. Wait, no: the problem says he runs across the field to the bucket. Wait, maybe initial distance: when he starts, he is at the starting line, so distance from bucket is, say, \( d \). Then he runs towards the bucket: distance decreases over time until he reaches the bucket (distance 0). Then he fills the sponge: during that time, distance from bucket remains 0 (since he's at the bucket). Then he runs back: distance increases over time as he moves away from the bucket to tag the next racer. Wait, no—wait, the question is "distance from the bucket over time". Let's re-examine:
- Phase 1: Running to the bucket
He starts at a point (not at the bucket), so initial distance from bucket is positive. As time increases, he moves towards the bucket, so distance from bucket decreases (linear, since running at constant speed) until he reaches the bucket (distance = 0).
- Phase 2: Filling the sponge
He is at the bucket, so distance from bucket remains 0 for some time (horizontal line).
- Phase 3: Running back
He runs back to tag the next racer, so distance from bucket increases (linear) as time increases.
Now, let's analyze the two graphs:
- Left graph: Starts at (0,0), distance increases (running away from bucket first), then flat (staying at some distance), then decreases. This doesn't match, because he should start by running towards the bucket (distance decreasing).
- Right graph: Starts at positive distance, decreases to 0 (running to bucket), stays at 0 (filling sponge), then increases (running back). This matches the three phases: decrease (to bucket), flat (filling), increase (running back).

Snap & solve any problem in the app
Get step-by-step solutions on Sovi AI
Photo-based solutions with guided steps
Explore more problems and detailed explanations
The right graph (the second one, with initial positive distance, decreasing to 0, flat, then increasing) shows Dan's distance from the bucket over time.