QUESTION IMAGE
Question
data analysis:
directions: use the graph below to answer the questions.
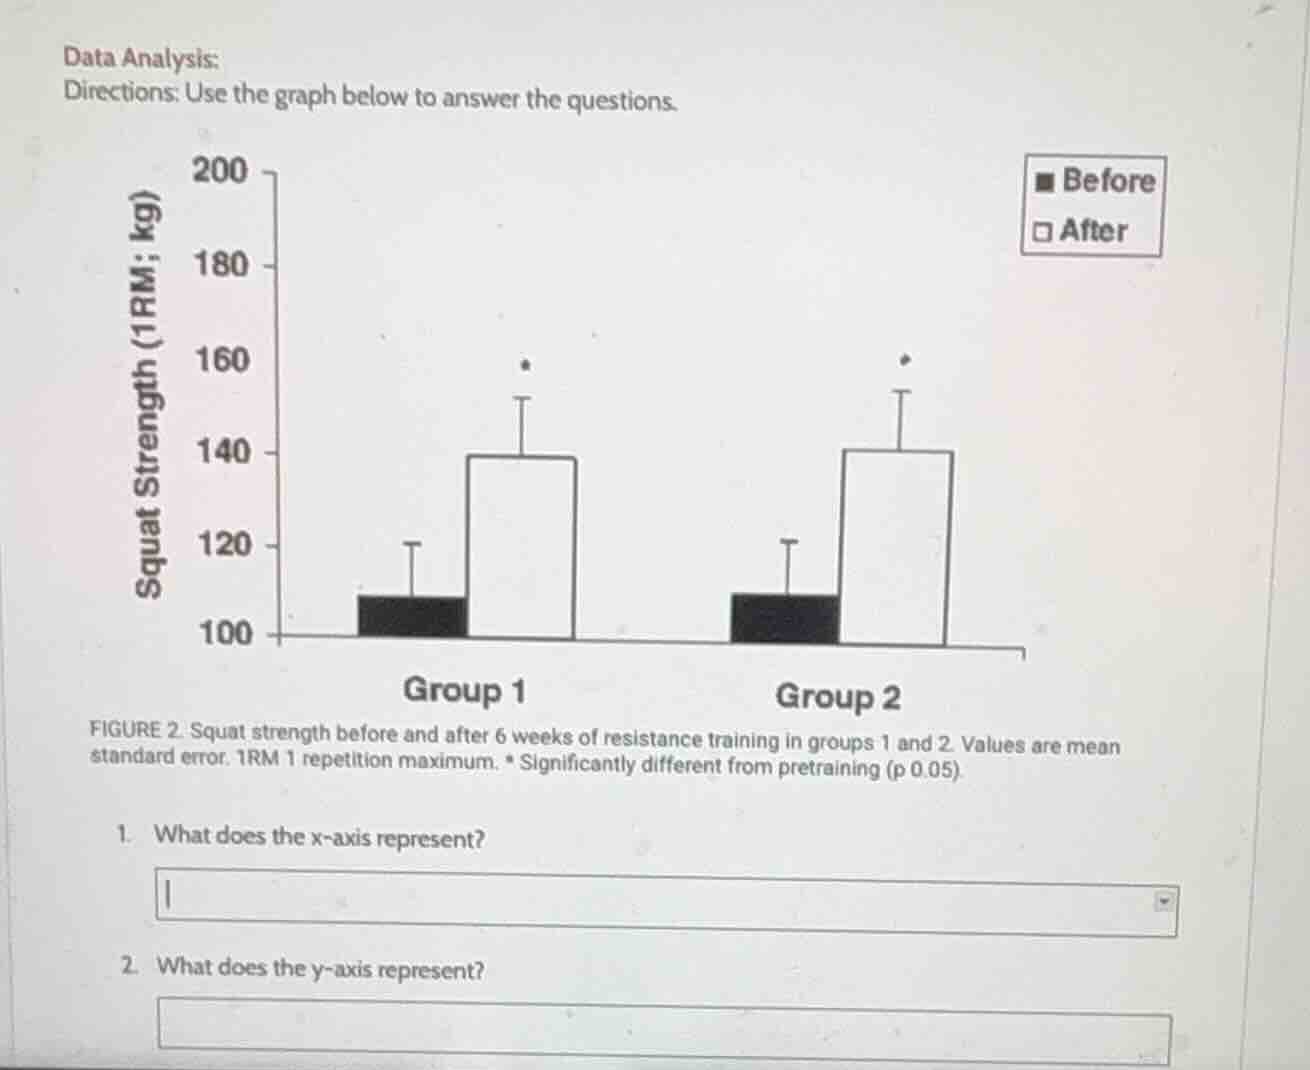
figure 2. squat strength before and after 6 weeks of resistance training in groups 1 and 2. values are mean standard error. 1rm 1 repetition maximum. * significantly different from pretraining (p 0.05).
- what does the x - axis represent?
- what does the y - axis represent?
Brief Explanations
- The x-axis labels are "Group 1" and "Group 2", which correspond to the two different groups that underwent resistance training as noted in the figure caption.
- The y-axis is clearly labeled with "Squat Strength (1RM; kg)", which is defined in the caption as 1 repetition maximum squat strength measured in kilograms.

Snap & solve any problem in the app
Get step-by-step solutions on Sovi AI
Photo-based solutions with guided steps
Explore more problems and detailed explanations
- The two groups (Group 1 and Group 2) that completed 6 weeks of resistance training
- Squat strength measured in 1 repetition maximum (1RM) in kilograms