QUESTION IMAGE
Question
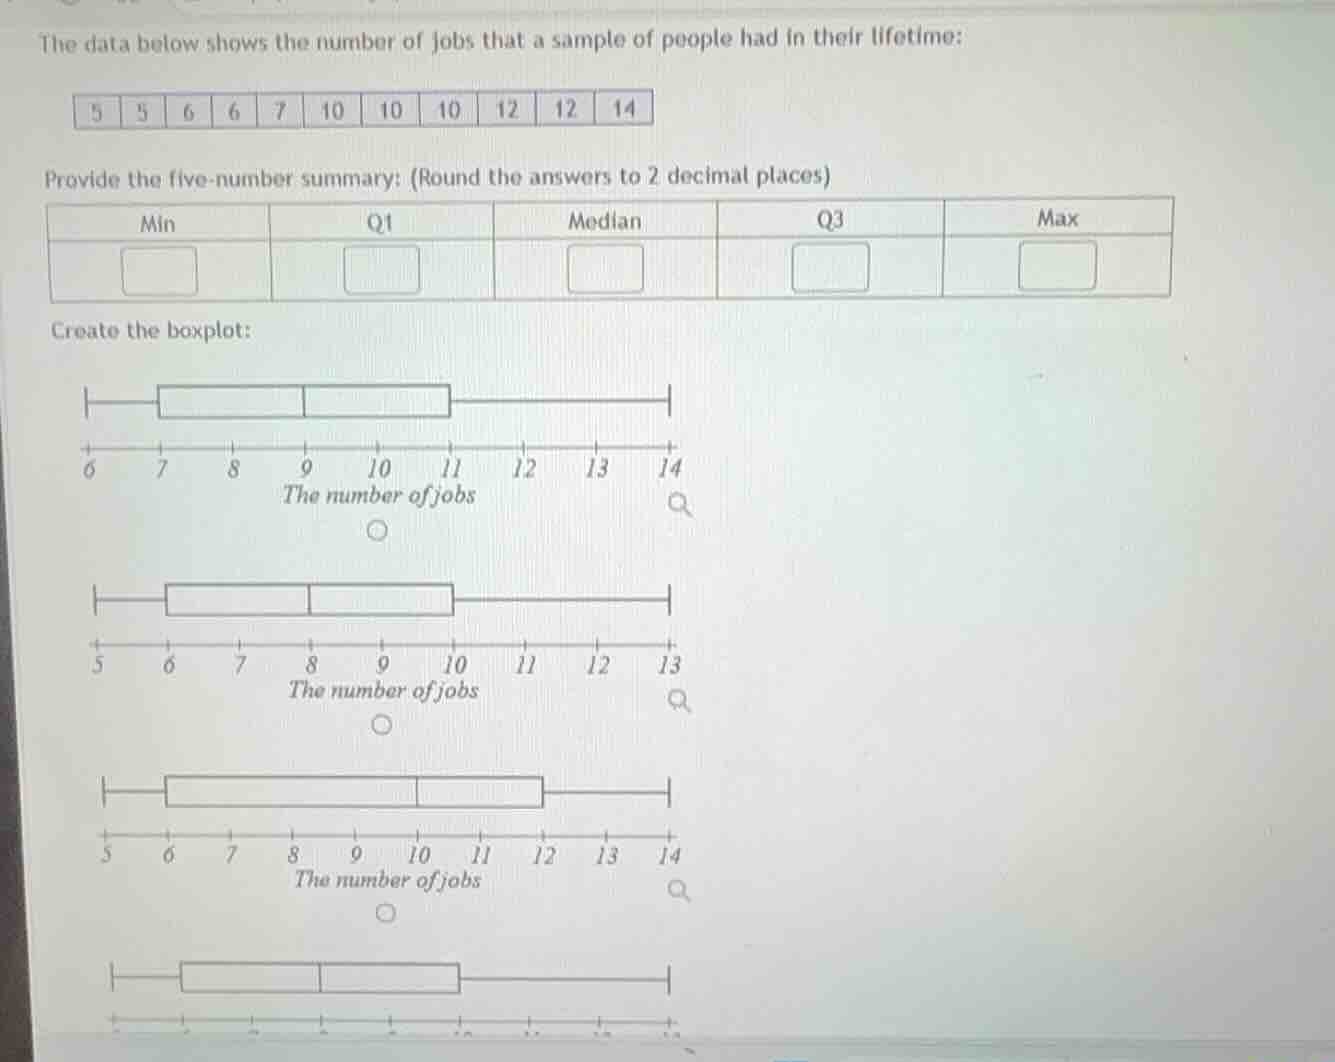
the data below shows the number of jobs that a sample of people had in their lifetime:
5 5 6 6 7 10 10 10 12 12 14
provide the five-number summary: (round the answers to 2 decimal places)
min q1 median q3 max
create the boxplot:
Step1: Identify Min and Max
Min = smallest value = $5$
Max = largest value = $14$
Step2: Find Median (2nd quartile)
Data set (sorted): $5,5,6,6,7,10,10,10,12,12,14$
$n=11$ (odd), median = 6th value: $10.00$
Step3: Calculate Q1 (1st quartile)
Lower half (values below median): $5,5,6,6,7$
Q1 = median of lower half = 3rd value: $6.00$
Step4: Calculate Q3 (3rd quartile)
Upper half (values above median): $10,10,12,12,14$
Q3 = median of upper half = 3rd value: $12.00$
Step5: Match to correct boxplot
Boxplot has min=5, Q1=6, median=10, Q3=12, max=14, matching the third option.

Snap & solve any problem in the app
Get step-by-step solutions on Sovi AI
Photo-based solutions with guided steps
Explore more problems and detailed explanations
Five-number summary:
Min: $5.00$
Q1: $6.00$
Median: $10.00$
Q3: $12.00$
Max: $14.00$
Correct boxplot: The third option (axis from 5 to 14, box edges at 6 and 12, median line at 10, whiskers at 5 and 14)