QUESTION IMAGE
Question
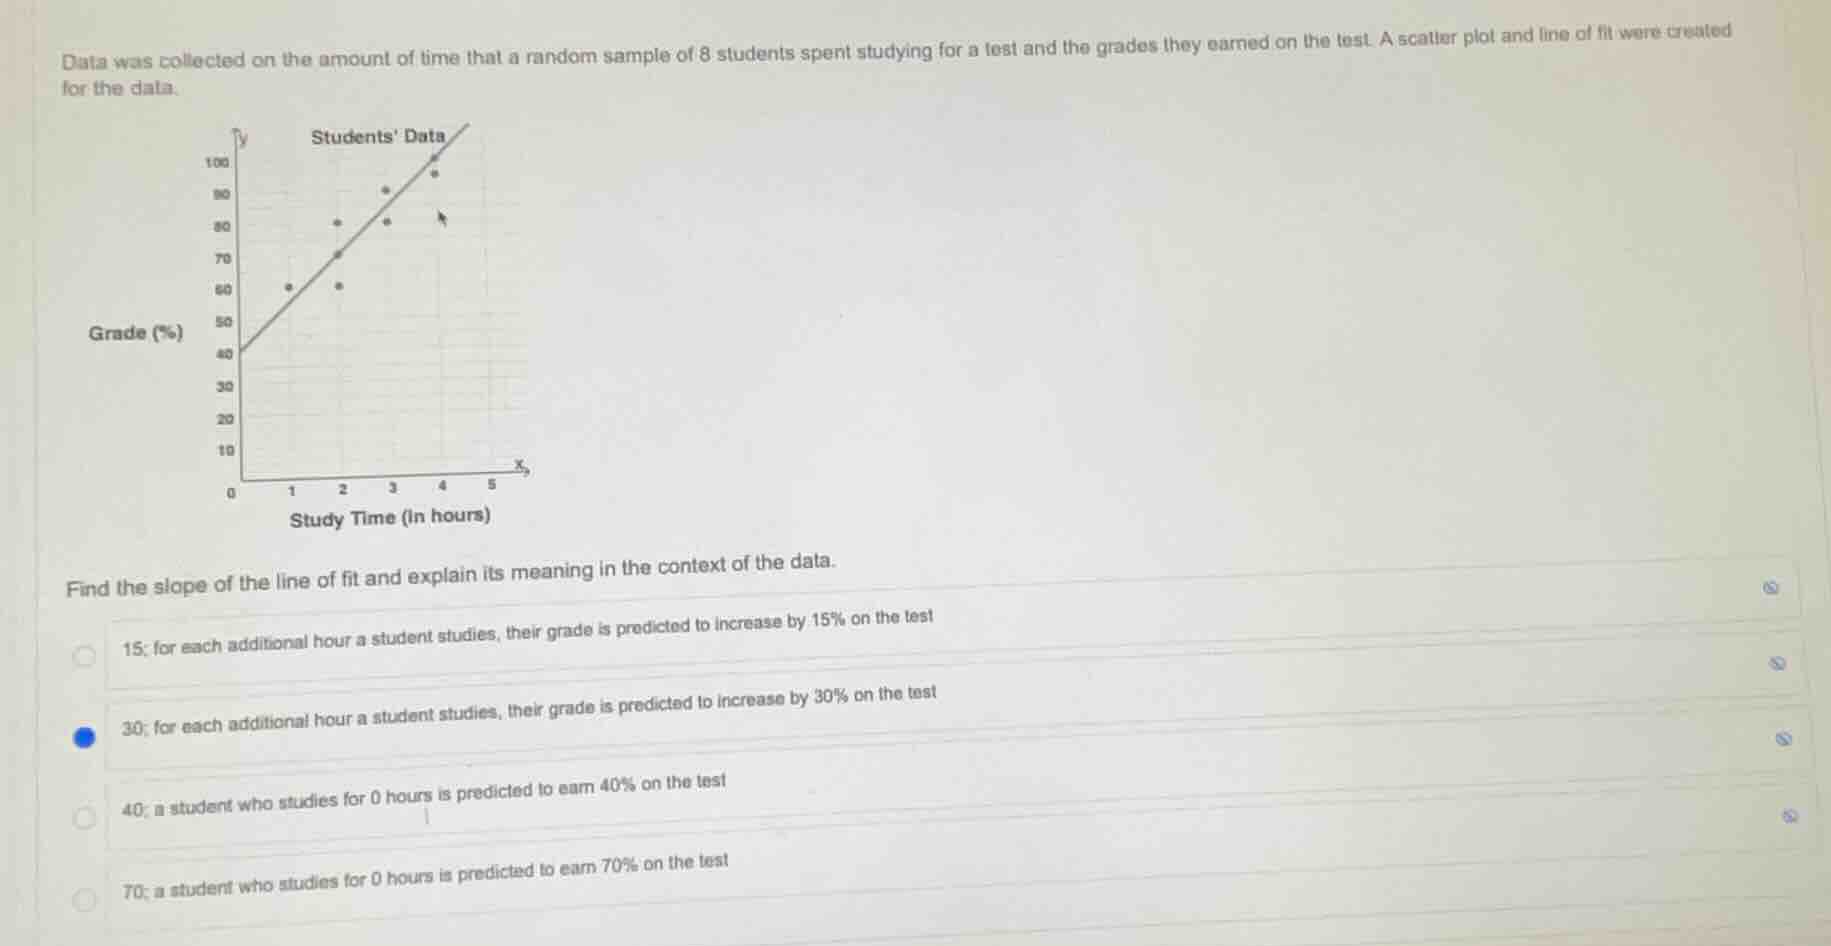
data was collected on the amount of time that a random sample of 8 students spent studying for a test and the grades they earned on the test. a scatter plot and line of fit were created for the data.
find the slope of the line of fit and explain its meaning in the context of the data.
15; for each additional hour a student studies, their grade is predicted to increase by 15% on the test
30; for each additional hour a student studies, their grade is predicted to increase by 30% on the test
40; a student who studies for 0 hours is predicted to earn 40% on the test
70; a student who studies for 0 hours is predicted to earn 70% on the test
Step1: Identify two line points
The line passes through (0, 40) and (4, 100).
Step2: Calculate slope via formula
Slope formula: $\text{slope} = \frac{y_2 - y_1}{x_2 - x_1}$
$\text{slope} = \frac{100 - 40}{4 - 0} = \frac{60}{4} = 15$
Step3: Interpret slope meaning
Slope = change in grade per study hour.

Snap & solve any problem in the app
Get step-by-step solutions on Sovi AI
Photo-based solutions with guided steps
Explore more problems and detailed explanations
15; for each additional hour a student studies, their grade is predicted to increase by 15% on the test