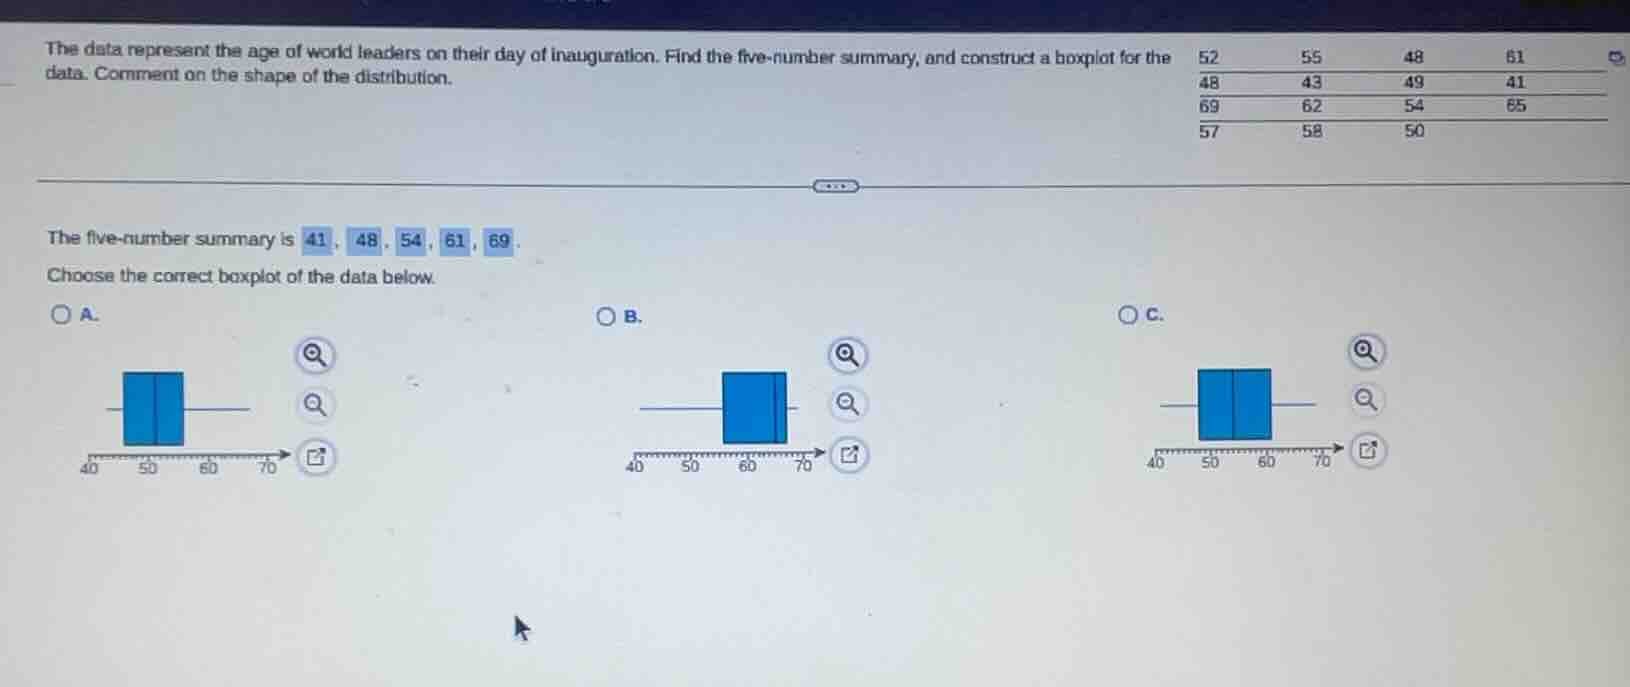
QUESTION IMAGE
Question
the data represent the age of world leaders on their day of inauguration. find the five-number summary, and construct a boxplot for the data. comment on the shape of the distribution.
52 55 48 61
48 43 49 41
69 62 54 65
57 58 50
the five-number summary is 41, 48, 54, 61, 69
choose the correct boxplot of the data below.
a.
b.
c.
Step1: List and sort all data
First, compile all data points: 52, 55, 48, 61, 48, 43, 49, 41, 69, 62, 54, 65, 57, 58, 50.
Sort them in ascending order:
$41, 43, 48, 48, 49, 50, 52, 54, 55, 57, 58, 61, 62, 65, 69$
Step2: Verify five-number summary
- Minimum (Min): Smallest value = $41$
- First Quartile ($Q_1$): Median of lower half (first 7 values: $41,43,48,48,49,50,52$) = $48$
- Median (Q2): 8th value of sorted data = $54$
- Third Quartile ($Q_3$): Median of upper half (last 7 values: $55,57,58,61,62,65,69$) = $61$
- Maximum (Max): Largest value = $69$
Step3: Match to correct boxplot
A boxplot has:
- Whiskers at Min=41 and Max=69
- Box edges at $Q_1=48$ and $Q_3=61$
- Line inside box at Median=54
This matches option C, where the left whisker starts at 41, right whisker at 69, box spans 48 to 61, and the median line is at 54.
Step4: Analyze distribution shape
Compare distances:
- Distance from Min to Median: $54-41=13$
- Distance from Median to Max: $69-54=15$
The right side (above median) is slightly longer, so the distribution is roughly symmetric with a very slight right skew (nearly symmetric).

Snap & solve any problem in the app
Get step-by-step solutions on Sovi AI
Photo-based solutions with guided steps
Explore more problems and detailed explanations
Five-number summary: $41, 48, 54, 61, 69$
Correct boxplot: C. (The boxplot with whiskers at 40-70, box from 48 to 61, median at 54)
Distribution shape: Roughly symmetric (very slight right skew)