QUESTION IMAGE
Question
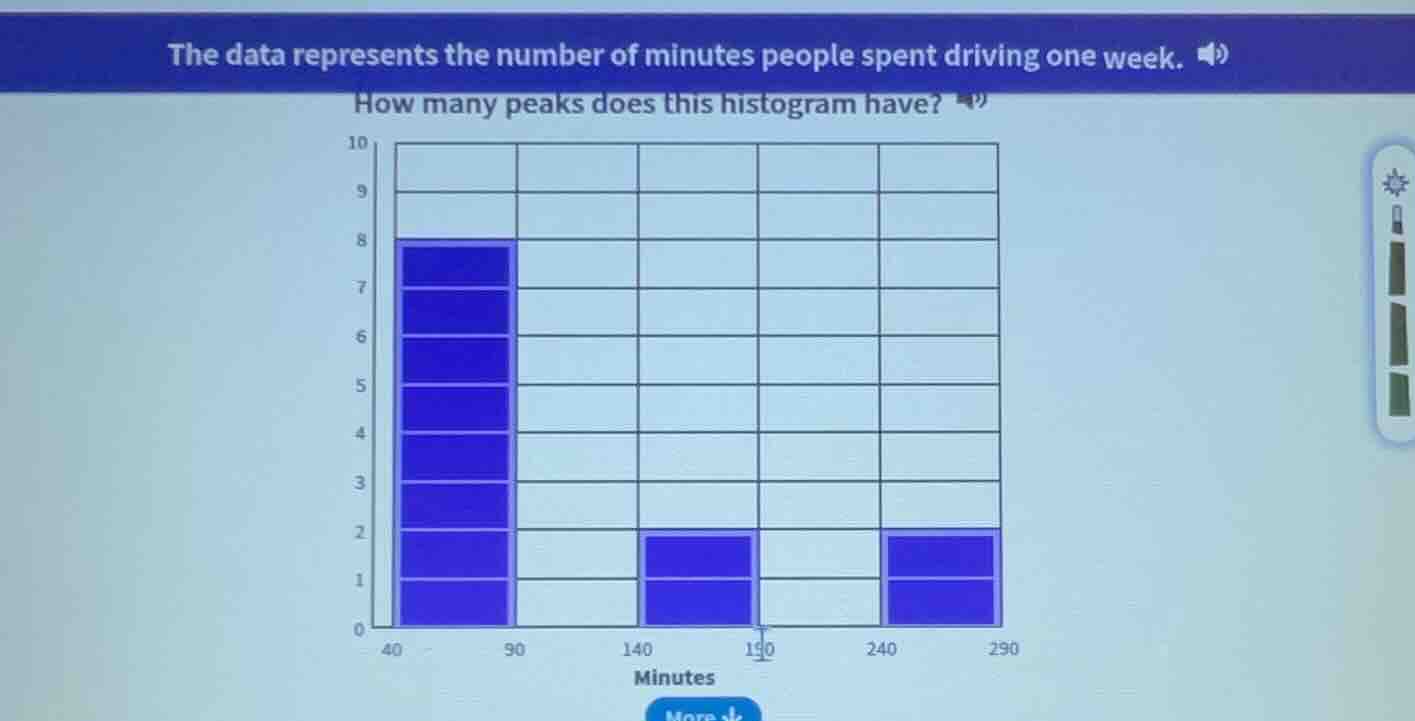
the data represents the number of minutes people spent driving one week. how many peaks does this histogram have?
Step1: Understand Histogram Peaks
A peak in a histogram is a bar that is higher than its adjacent bars. We examine each bar's height relative to neighbors.
Step2: Analyze Each Bar Group
- First group (40 - 90 minutes): The bar here is tall (height 8), and adjacent bars (next to 90) are shorter (height 0). So this is a peak.
- Second group (140 - 190 minutes): The bar here has height 2, adjacent bars (before 140: height 0; after 190: height 0) are shorter? Wait, no—wait, the bar at 40 - 90 is tall, then 90 - 140 is 0, then 140 - 190 is 2, 190 - 240 is 0, 240 - 290 is 2. Wait, no, re - examine: The first bar (40 - 90) is height 8 (tallest so far). Then 90 - 140: height 0. Then 140 - 190: height 2. Then 190 - 240: height 0. Then 240 - 290: height 2. Wait, but the first bar (40 - 90) is a peak (higher than left (none, since it's the first) and right (90 - 140 is 0)). Then 140 - 190: is it a peak? Its left is 0, right is 0, so it's a peak? Wait, no, a peak is a local maximum. So the first bar (40 - 90) is a local max (higher than right). Then 140 - 190: its left is 0, right is 0, so it's a local max? Wait, no, the height of 140 - 190 is 2, and 240 - 290 is also 2. Wait, maybe I misread. Wait the histogram: x - axis is minutes (40 - 90, 90 - 140, 140 - 190, 190 - 240, 240 - 290). The y - axis is count. The first bar (40 - 90) has height 8 (from 0 to 8). Then 90 - 140: height 0. Then 140 - 190: height 2 (from 0 to 2). Then 190 - 240: height 0. Then 240 - 290: height 2 (from 0 to 2). Wait, but the first bar (40 - 90) is a peak (since it's higher than its right neighbor (90 - 140, height 0)). Then 140 - 190: is it a peak? Its left is 0, right is 0, so it's a local maximum. Similarly, 240 - 290: left is 0, right is none (end), so is it a peak? Wait no, the definition of a peak in a histogram is a bar that is higher than both its left and right neighbors (or one neighbor if it's at the end, but usually local maximum). Wait, the first bar (40 - 90): left neighbor: none (start), right neighbor: 90 - 140 (height 0). So it's a peak. The 140 - 190 bar: left neighbor 90 - 140 (height 0), right neighbor 190 - 240 (height 0). So it's a peak. The 240 - 290 bar: left neighbor 190 - 240 (height 0), right neighbor: none (end). So is it a peak? Wait, but the height of 140 - 190 and 240 - 290 is 2, same. But the first bar is height 8. Wait, maybe I made a mistake. Wait the original histogram: looking at the graph, the first bar (40 - 90) is tall (height 8), then 90 - 140 is 0, then 140 - 190 is 2, 190 - 240 is 0, 240 - 290 is 2. So the peaks are the bars that are higher than their adjacent bars. So the first bar (40 - 90) is a peak (higher than right). The 140 - 190 bar: higher than left (0) and right (0). The 240 - 290 bar: higher than left (0). Wait, no, maybe the question's histogram has three peaks? Wait no, wait the first bar (40 - 90) is one peak. Then 140 - 190 is another (since left is 0, right is 0). Then 240 - 290 is another? Wait no, the height of 140 - 190 and 240 - 290 is same, but are they peaks? Wait, no, maybe I misread the heights. Wait the y - axis: 0,1,2,3,4,5,6,7,8,9,10. The first bar (40 - 90) goes up to 8. Then 90 - 140: 0. Then 140 - 190: up to 2. Then 190 - 240: 0. Then 240 - 290: up to 2. So the peaks are the bars where the height is a local maximum. So the first bar (40 - 90) is a peak (local max, since right is lower). The 140 - 190 bar: local max (left and right lower). The 240 - 290 bar: local max (left lower, right none). Wait, but that would be three? Wait no, maybe the 140 - 190 and 240 - 290 are not peaks because their…

Snap & solve any problem in the app
Get step-by-step solutions on Sovi AI
Photo-based solutions with guided steps
Explore more problems and detailed explanations
3