QUESTION IMAGE
Question
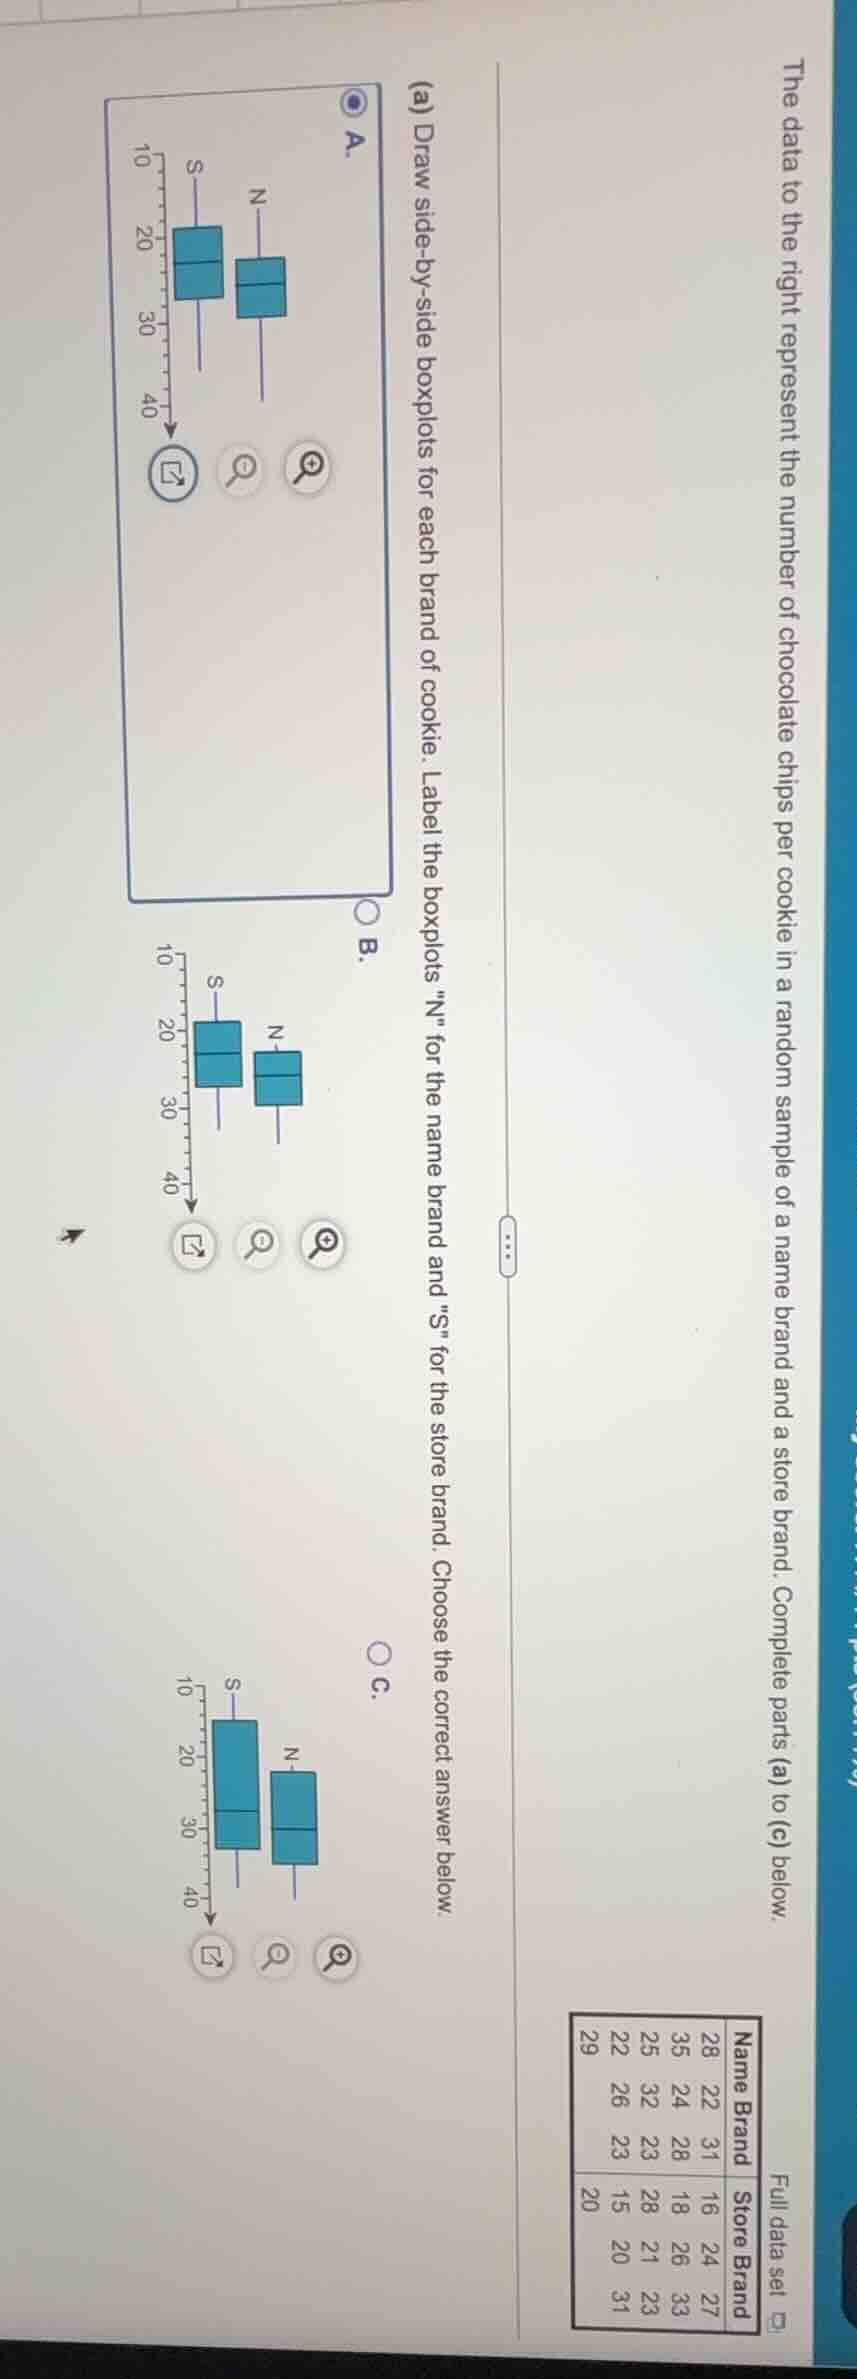
the data to the right represent the number of chocolate chips per cookie in a random sample of a name brand and a store brand. complete parts (a) to (c) below.full data setname brand: 28, 22, 31, 16, 24, 27, 35, 24, 28, 18, 26, 33, 25, 32, 23, 28, 21, 23, 22, 26, 23, 15, 20, 31, 29, 20store brand:(a) draw side-by-side boxplots for each brand of cookie. label the boxplots
\ for the name brand and \s\ for the store brand. choose the correct answer below.a. boxplot for n and sb. boxplot for n and sc. boxplot for n and s
Step1: Calculate stats for Name Brand (N)
First, sort Name Brand data: 22, 23, 24, 25, 26, 28, 28, 31, 32, 35
- Min = 22, Q1 = $\frac{23+24}{2}=23.5$, Median = $\frac{26+28}{2}=27$, Q3 = $\frac{28+31}{2}=29.5$, Max = 35
Step2: Calculate stats for Store Brand (S)
Sort Store Brand data: 15, 16, 18, 20, 21, 23, 24, 26, 27, 33
- Min = 15, Q1 = $\frac{16+18}{2}=17$, Median = $\frac{21+23}{2}=22$, Q3 = $\frac{24+26}{2}=25$, Max = 33
Step3: Match to boxplot options
Compare stats: Store Brand (S) has lower median, Q1, Q3 than Name Brand (N); Store Brand's max is 33, Name Brand's max is 35. This matches option B.

Snap & solve any problem in the app
Get step-by-step solutions on Sovi AI
Photo-based solutions with guided steps
Explore more problems and detailed explanations
B. <the boxplot labeled B with "N" (name brand) having a higher median and quartiles than "S" (store brand)>