QUESTION IMAGE
Question
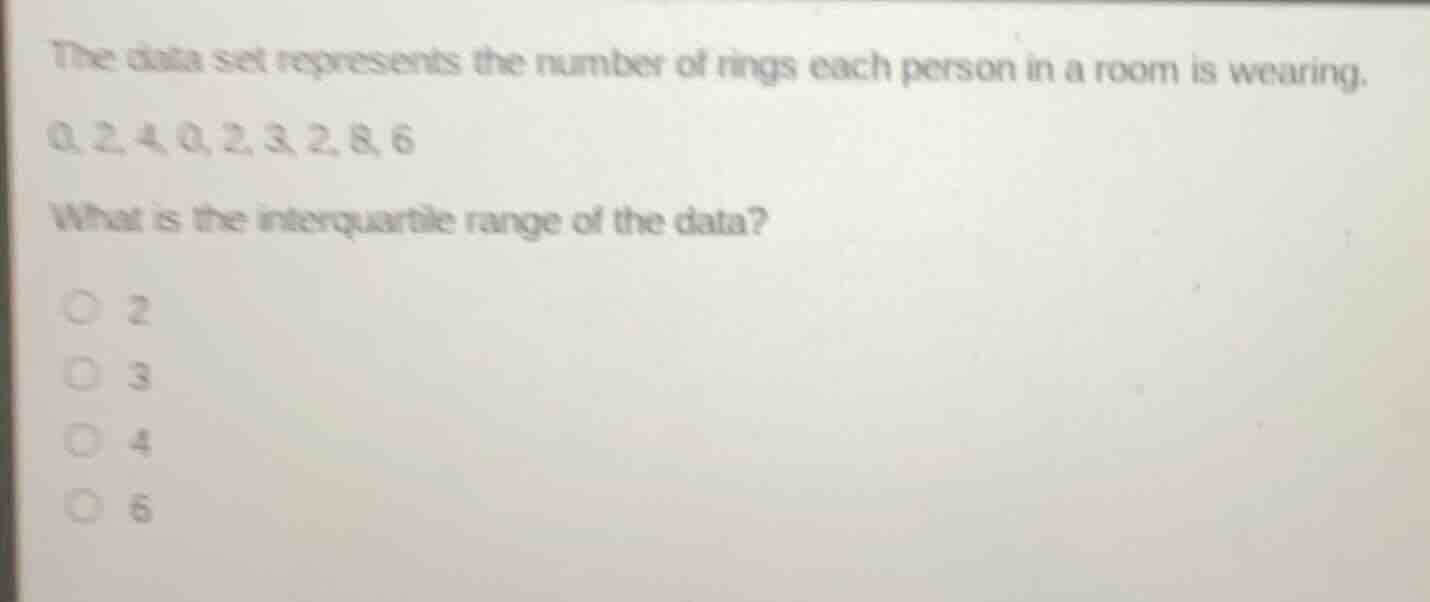
the data set represents the number of rings each person in a room is wearing.
0, 2, 4, 0, 2, 3, 2, 8, 6
what is the interquartile range of the data?
○ 2
○ 3
○ 4
○ 6
Step1: Sort the data set
Sorted data: $0, 0, 2, 2, 2, 3, 4, 6, 8$
Step2: Find median (Q2)
Median is the 5th value: $2$
Step3: Find Q1 (lower median)
Lower half: $0, 0, 2, 2$; Q1 = $\frac{0+2}{2}=1$
Step4: Find Q3 (upper median)
Upper half: $3, 4, 6, 8$; Q3 = $\frac{4+6}{2}=5$
Step5: Calculate interquartile range
Interquartile range = $Q3 - Q1$
$5 - 1 = 4$

Snap & solve any problem in the app
Get step-by-step solutions on Sovi AI
Photo-based solutions with guided steps
Explore more problems and detailed explanations
4