QUESTION IMAGE
Question
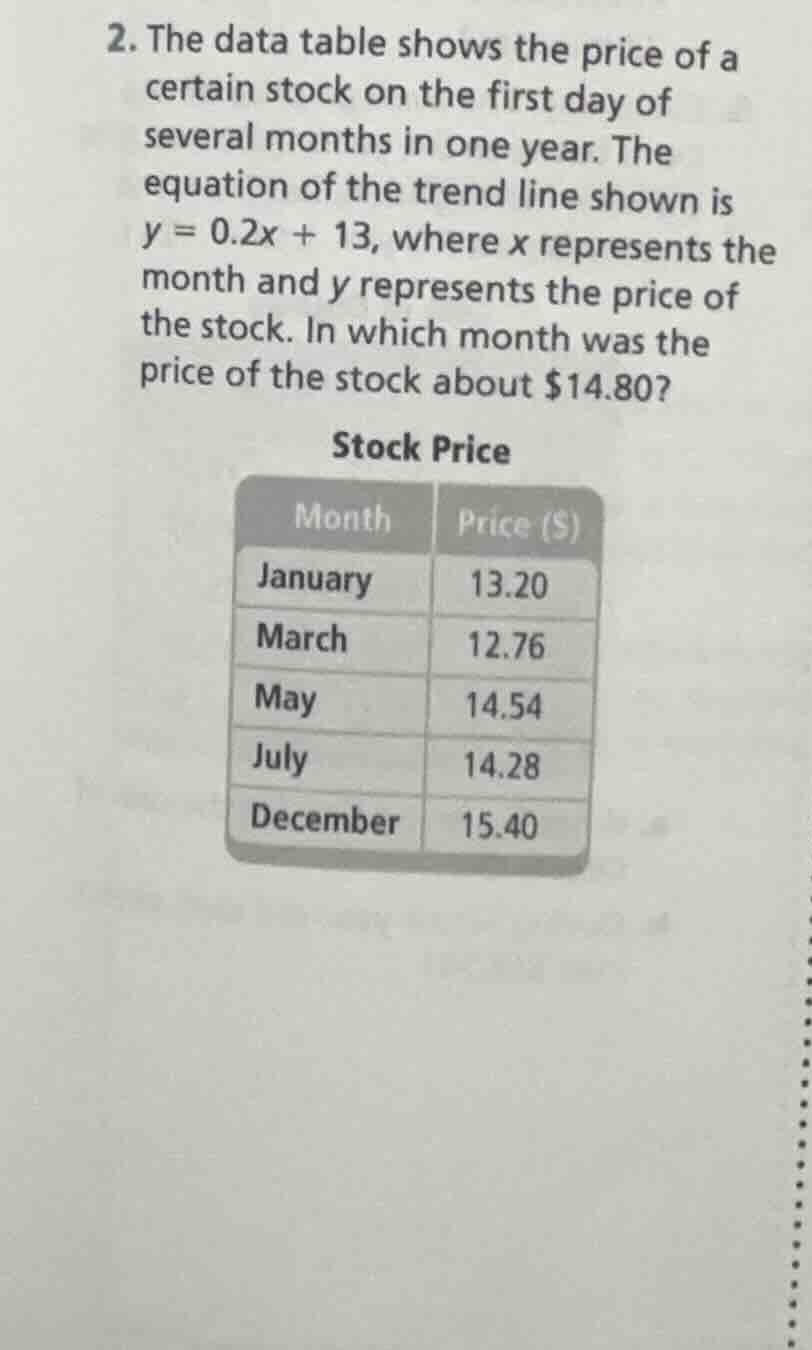
- the data table shows the price of a certain stock on the first day of several months in one year. the equation of the trend line shown is $y = 0.2x + 13$, where $x$ represents the month and $y$ represents the price of the stock. in which month was the price of the stock about $14.80?
stock price
| month | price ($) |
|---|---|
| march | 12.76 |
| may | 14.54 |
| july | 14.28 |
| december | 15.40 |
Step1: Substitute y with 14.80
$14.80 = 0.2x + 13$
Step2: Subtract 13 from both sides
$14.80 - 13 = 0.2x$
$1.80 = 0.2x$
Step3: Solve for x
$x = \frac{1.80}{0.2}$
$x = 9$
Step4: Map x=9 to month
Month 9 corresponds to September.

Snap & solve any problem in the app
Get step-by-step solutions on Sovi AI
Photo-based solutions with guided steps
Explore more problems and detailed explanations
September (month 9)