QUESTION IMAGE
Question
december review assignment
algebra k
for each question, you must show work or write a sentence explaining why the answer you chose is
correct. you will earn 2 points for each correct answer with work or a justification, and 0 points if no
work or justification is shown regardless of whether your answer is correct.
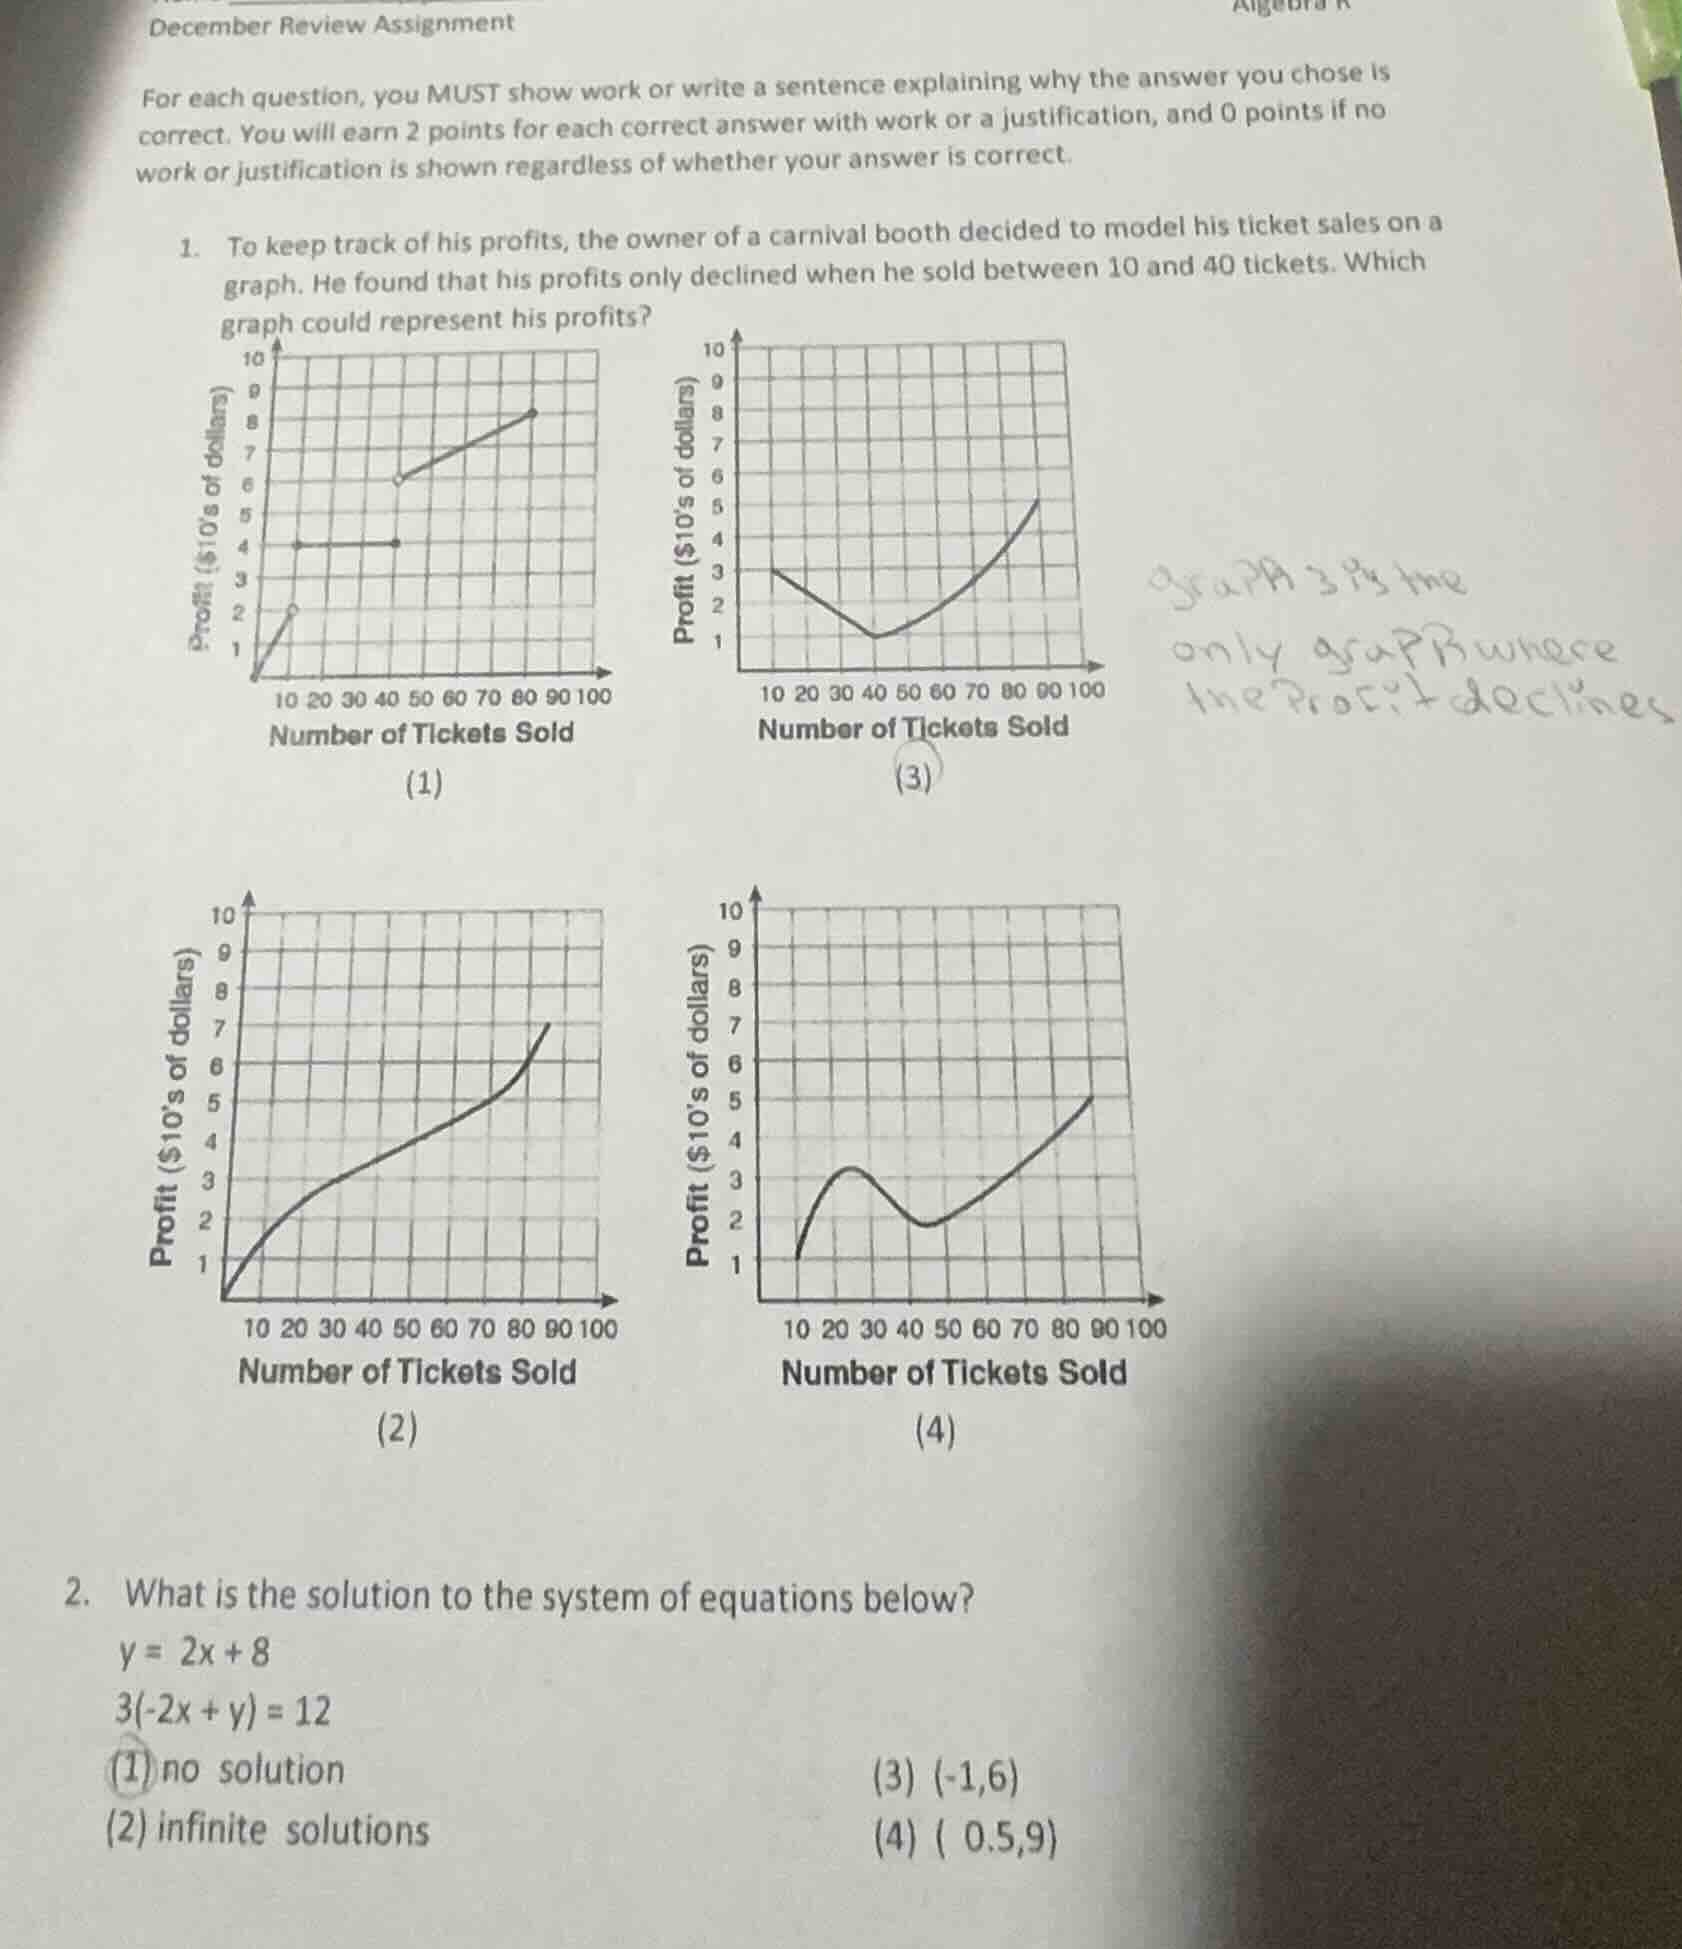
- to keep track of his profits, the owner of a carnival booth decided to model his ticket sales on a
graph. he found that his profits only declined when he sold between 10 and 40 tickets. which
graph could represent his profits?
(1)
(3)
(2)
(4)
- what is the solution to the system of equations below?
y = 2x + 8
3(-2x + y) = 12
(1) no solution
(3) (-1,6)
(2) infinite solutions
(4) ( 0.5,9)
Question 1
Step1: Analyze profit trend condition
We need a graph where profit declines (the graph has a decreasing slope) only between 10 and 40 tickets sold.
Step2: Evaluate each graph
- Graph (1): Profit is constant between 10 - 40, not declining. Eliminate.
- Graph (2): Profit is always increasing. Eliminate.
- Graph (3): Profit decreases from 10 - 40 (slope negative) and increases otherwise. Matches the condition.
- Graph (4): Profit has two declines (around 10 - 30 and 30 - 50), not only 10 - 40. Eliminate.
Step1: Simplify the second equation
Start with \( 3(-2x + y)=12 \). Divide both sides by 3: \( -2x + y = 4 \), which can be rewritten as \( y = 2x + 4 \).
Step2: Compare with first equation
The first equation is \( y = 2x + 8 \). These are two linear equations with the same slope (\( m = 2 \)) but different y - intercepts (\( 8 \) vs \( 4 \)). Parallel lines (same slope, different intercepts) never intersect, so there's no solution.

Snap & solve any problem in the app
Get step-by-step solutions on Sovi AI
Photo-based solutions with guided steps
Explore more problems and detailed explanations
Graph (3)