QUESTION IMAGE
Question
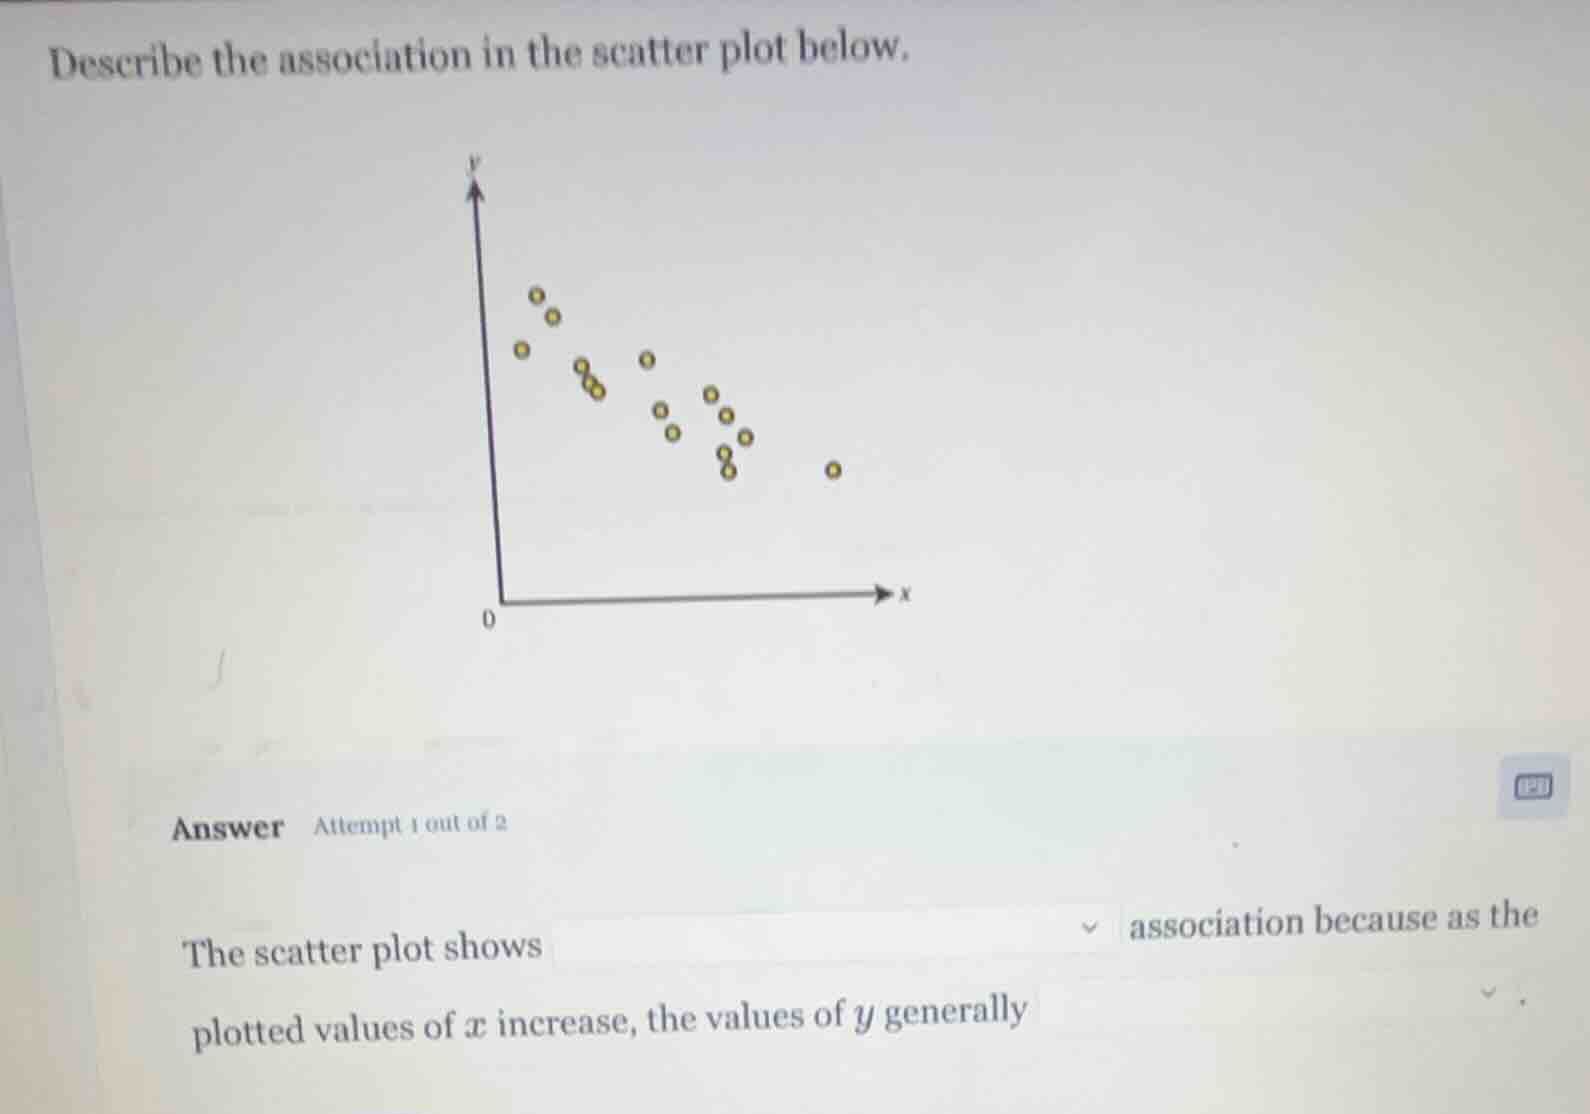
describe the association in the scatter plot below.
answer attempt 1 out of 2
the scatter plot shows
association because as the
plotted values of $x$ increase, the values of $y$ generally
Brief Explanations
First, observe the overall trend of the points in the scatter plot: as x-values move from left to right (increase), the y-values of the points tend to move downward (decrease). The points cluster closely along a general downward trend, so the association is strong.

Snap & solve any problem in the app
Get step-by-step solutions on Sovi AI
Photo-based solutions with guided steps
Explore more problems and detailed explanations
The scatter plot shows a strong negative association because as the plotted values of $x$ increase, the values of $y$ generally decrease.